
Introduction
The previous articles in this section each covered one tool or data layer in depth. In practice, no single tool gives you the full picture. The edge comes from combining them — using each source for the specific questions it answers best, and cross-referencing signals across layers to build a view with more conviction than any one source could provide.
This article shows how the five tools work together as a system. It is organised around three practical use cases: establishing your macro position, evaluating a specific token, and timing an entry or exit. For each use case, you will see which tool answers which question and in what order to run through them.
The goal is not to use all five tools on every decision — it is to know which tools are relevant to the decision you are making and to have a repeatable process for consulting them.
The Five Tools and Their Role
Before showing how they combine, here is a clear statement of what each tool does best — and what it does not do.
| Tool | Best for | Does not cover |
|---|---|---|
| CoinGecko | Market structure: market cap, FDV, supply, volume, exchange listings, dominance | On-chain behaviour, derivatives positioning, protocol usage |
| Glassnode | Bitcoin and Ethereum on-chain cycle indicators: MVRV, SOPR, LTH/STH supply, exchange flows | Altcoin data, derivatives, DeFi protocol metrics |
| TradingView | Price action, technical analysis, moving averages, volume, cross-asset comparison | On-chain data, derivatives positioning, tokenomics |
| CoinGlass | Derivatives: open interest, funding rates, liquidation maps, real-time liquidation events | On-chain fundamentals, spot market structure, protocol usage |
| DeFiLlama | DeFi protocol usage: TVL, revenue, chain flows, yield rates, stablecoin supply | Bitcoin on-chain data, derivatives, spot market structure |
Notice that the tools have almost no overlap — they are genuinely complementary rather than redundant. This means there is little wasted effort in consulting all five; each one adds information that the others cannot provide.
Use Case 1 — Establishing Your Macro Position
The question: where are we in the cycle, and what should my overall risk allocation be?
This is a monthly or bi-monthly exercise. Run through the tools in this order:
Step 1 — CoinGecko: market-wide context (5 minutes)
Check total crypto market cap, BTC dominance and stablecoin market cap. These three numbers orient you within the macro cycle: – Is total market cap at all-time highs, mid-range, or near lows? – Is BTC dominance rising (early cycle, risk-off) or falling (mid/late cycle, altcoin season)? – Is stablecoin supply expanding (capital entering) or contracting (capital exiting)?
Step 2 — Glassnode: cycle positioning (10 minutes)
Run the six-metric weekly review from the Glassnode in Practice article. Establish your MVRV zone, check LTH vs STH supply trends, and note whether exchange flows are net positive or negative.
Step 3 — CoinGlass: derivatives sentiment (5 minutes)
Check the annualised quarterly basis and 30-day average funding rate for Bitcoin. Are derivatives markets confirming or diverging from the on-chain picture?
Output: a single macro stance — accumulation, position-building, or distribution — with a one-sentence rationale combining the three layers.
| Macro Stance | Typical Conditions |
|---|---|
| Accumulation | MVRV below 1, LTH supply rising, exchange outflows, basis near zero, BTC dominance high |
| Position-building | MVRV 1–4, LTH supply stable, moderate funding, basis 5–15%, dominance beginning to fall |
| Selective / neutral | MVRV 4–6, mixed signals across tools, basis elevated, STH supply rising |
| Distribution / defensive | MVRV above 6, LTH supply falling sharply, basis above 20%, funding strongly positive, dominance falling fast |
Use Case 2 — Evaluating a Specific Token
The question: is this token worth buying, and at what size?
This is the 30-minute token research routine from the previous article, extended with the additional tool layers.
Step 1 — CoinGecko (5 minutes): market structure — FDV, supply, unlock schedule, volume, exchange listings.
Step 2 — Project documentation (5 minutes): use case, token necessity, partnerships.
Step 3 — Chain explorer (10 minutes): holder concentration, transaction activity, unique addresses.
Step 4 — DeFiLlama (5 minutes, DeFi tokens only): TVL trend, fee revenue vs token incentives, TVL/market cap ratio vs comparables.
Step 5 — TradingView (5 minutes): price action context — where is the token in its own price history? Is it near all-time highs, mid-range, or near lows? How does its performance compare with Bitcoin and ETH over the last 3 and 12 months?
The TradingView step is often skipped during fundamental research — this is a mistake. A token with strong fundamentals trading near all-time highs has a different risk/reward from the same token at 80% below its high. Price history is context, not a signal, but it belongs in the research process.
Step 6 — CoinGlass (3 minutes, if futures exist): does the token have liquid futures markets? If so, what does the current funding rate say about positioning? A token with strong fundamentals and negative funding (crowded shorts) is a more attractive entry than the same token with strongly positive funding.
Output: Pass / Watchlist / Research complete + proposed position size relative to your standard risk unit.
Use Case 3 — Timing an Entry or Exit
The question: given that I have decided to buy (or sell), when and at what price?
This is where TradingView and CoinGlass do the heavy lifting. On-chain tools are too slow for timing — they update daily and reflect behaviour over days and weeks, not hours.
Step 1 — TradingView: technical structure (10 minutes)
Identify the key levels: support, resistance, the relevant moving averages (MA20, MA200), and the current trend structure. You are looking for one of three conditions: – A clean level to buy into (a support test with clear invalidation below) – A breakout to buy on confirmation (a resistance level that, if broken, changes the structure) – A level to fade (an overextended move into resistance with weak momentum)
Step 2 — CoinGlass: derivatives context (5 minutes)
Before entering, check three things: 1. Current funding rate — is it elevated? If so, consider waiting for a reset 2. OI trend — is OI rising into this level (new positions being opened, more volatile) or falling (positions being closed, potentially exhaustion)? 3. Liquidation map — does a significant liquidation cluster sit just below your entry (adding downside risk) or just above (adding upside fuel)?
Step 3 — Glassnode: one final sanity check (3 minutes)
Is the aSOPR above or below 1.0? Buying into a confirmed bull regime (aSOPR consistently above 1.0) is different from buying in a bear regime where every bounce has been sold. One data point, one minute — but it prevents the mistake of applying bull market tactics in a bear market.
Output: entry price, stop level, initial target, and position size.
How the Tools Cross-Reference Each Other
The most valuable moments in multi-tool analysis are when the tools diverge — when one is saying something different from the others. Divergence is information.
On-chain bullish but derivatives bearish: Glassnode shows LTH accumulation and exchange outflows, but CoinGlass shows negative funding and falling OI. This can mean institutional holders are accumulating while retail is capitulating — historically a bullish setup, but patient positioning is required as retail selling may continue.
Derivatives bullish but on-chain bearish: funding strongly positive and OI rising, but MVRV elevated and LTH supply falling. This is the dangerous setup — speculative excitement in derivatives not supported by fundamental cycle positioning. The derivatives enthusiasm is the short-term driver but the on-chain data suggests the macro cycle is mature.
DeFiLlama and CoinGecko diverging: a DeFi token with rising market cap but falling TVL on DeFiLlama. TVL is the fundamental driver of DeFi protocol value — if it is falling while the token price rises, the market is pricing in future recovery that the data does not yet support. Proceed with caution.
TradingView and CoinGlass diverging: a technically bullish setup (price above MA200, breaking resistance) but CoinGlass showing crowded longs and elevated funding. The technical setup is real, but the fuel for a sustained move is reduced. A smaller initial position with a plan to add after a funding reset is appropriate.
Building the Habit
The tool stack is only useful if it is consulted consistently. Three practices that make this sustainable:
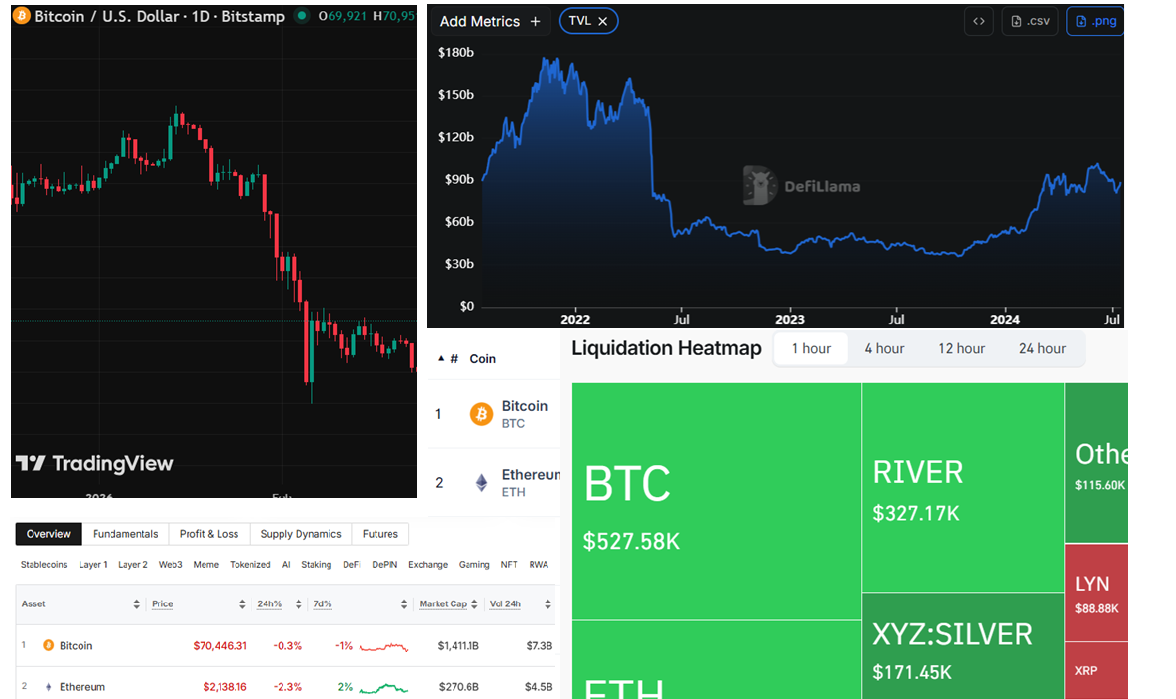
Bookmark a single starting page for each tool. Not the homepage — the specific view you use most often. For CoinGecko, this is the global market overview. For Glassnode, your saved dashboard. For CoinGlass, the BTC open interest page. For TradingView, your saved BTC/USDT chart with your indicators. For DeFiLlama, the protocol overview sorted by revenue.
Separate the cadences. Macro review (Glassnode + CoinGecko + CoinGlass basis): monthly. Token evaluation: per opportunity. Timing check (TradingView + CoinGlass): per trade. Do not check everything every day — it produces noise and analysis paralysis.
Write down your view. After a macro review, write one sentence. After a token evaluation, write three sentences (what it does, what the risk is, what would make you buy). After a timing check, write the entry, stop and target. Without a written record, you cannot learn from your process.
Key Takeaways
- The five tools are genuinely complementary — each answers questions the others cannot, so consulting all five adds information with minimal redundancy
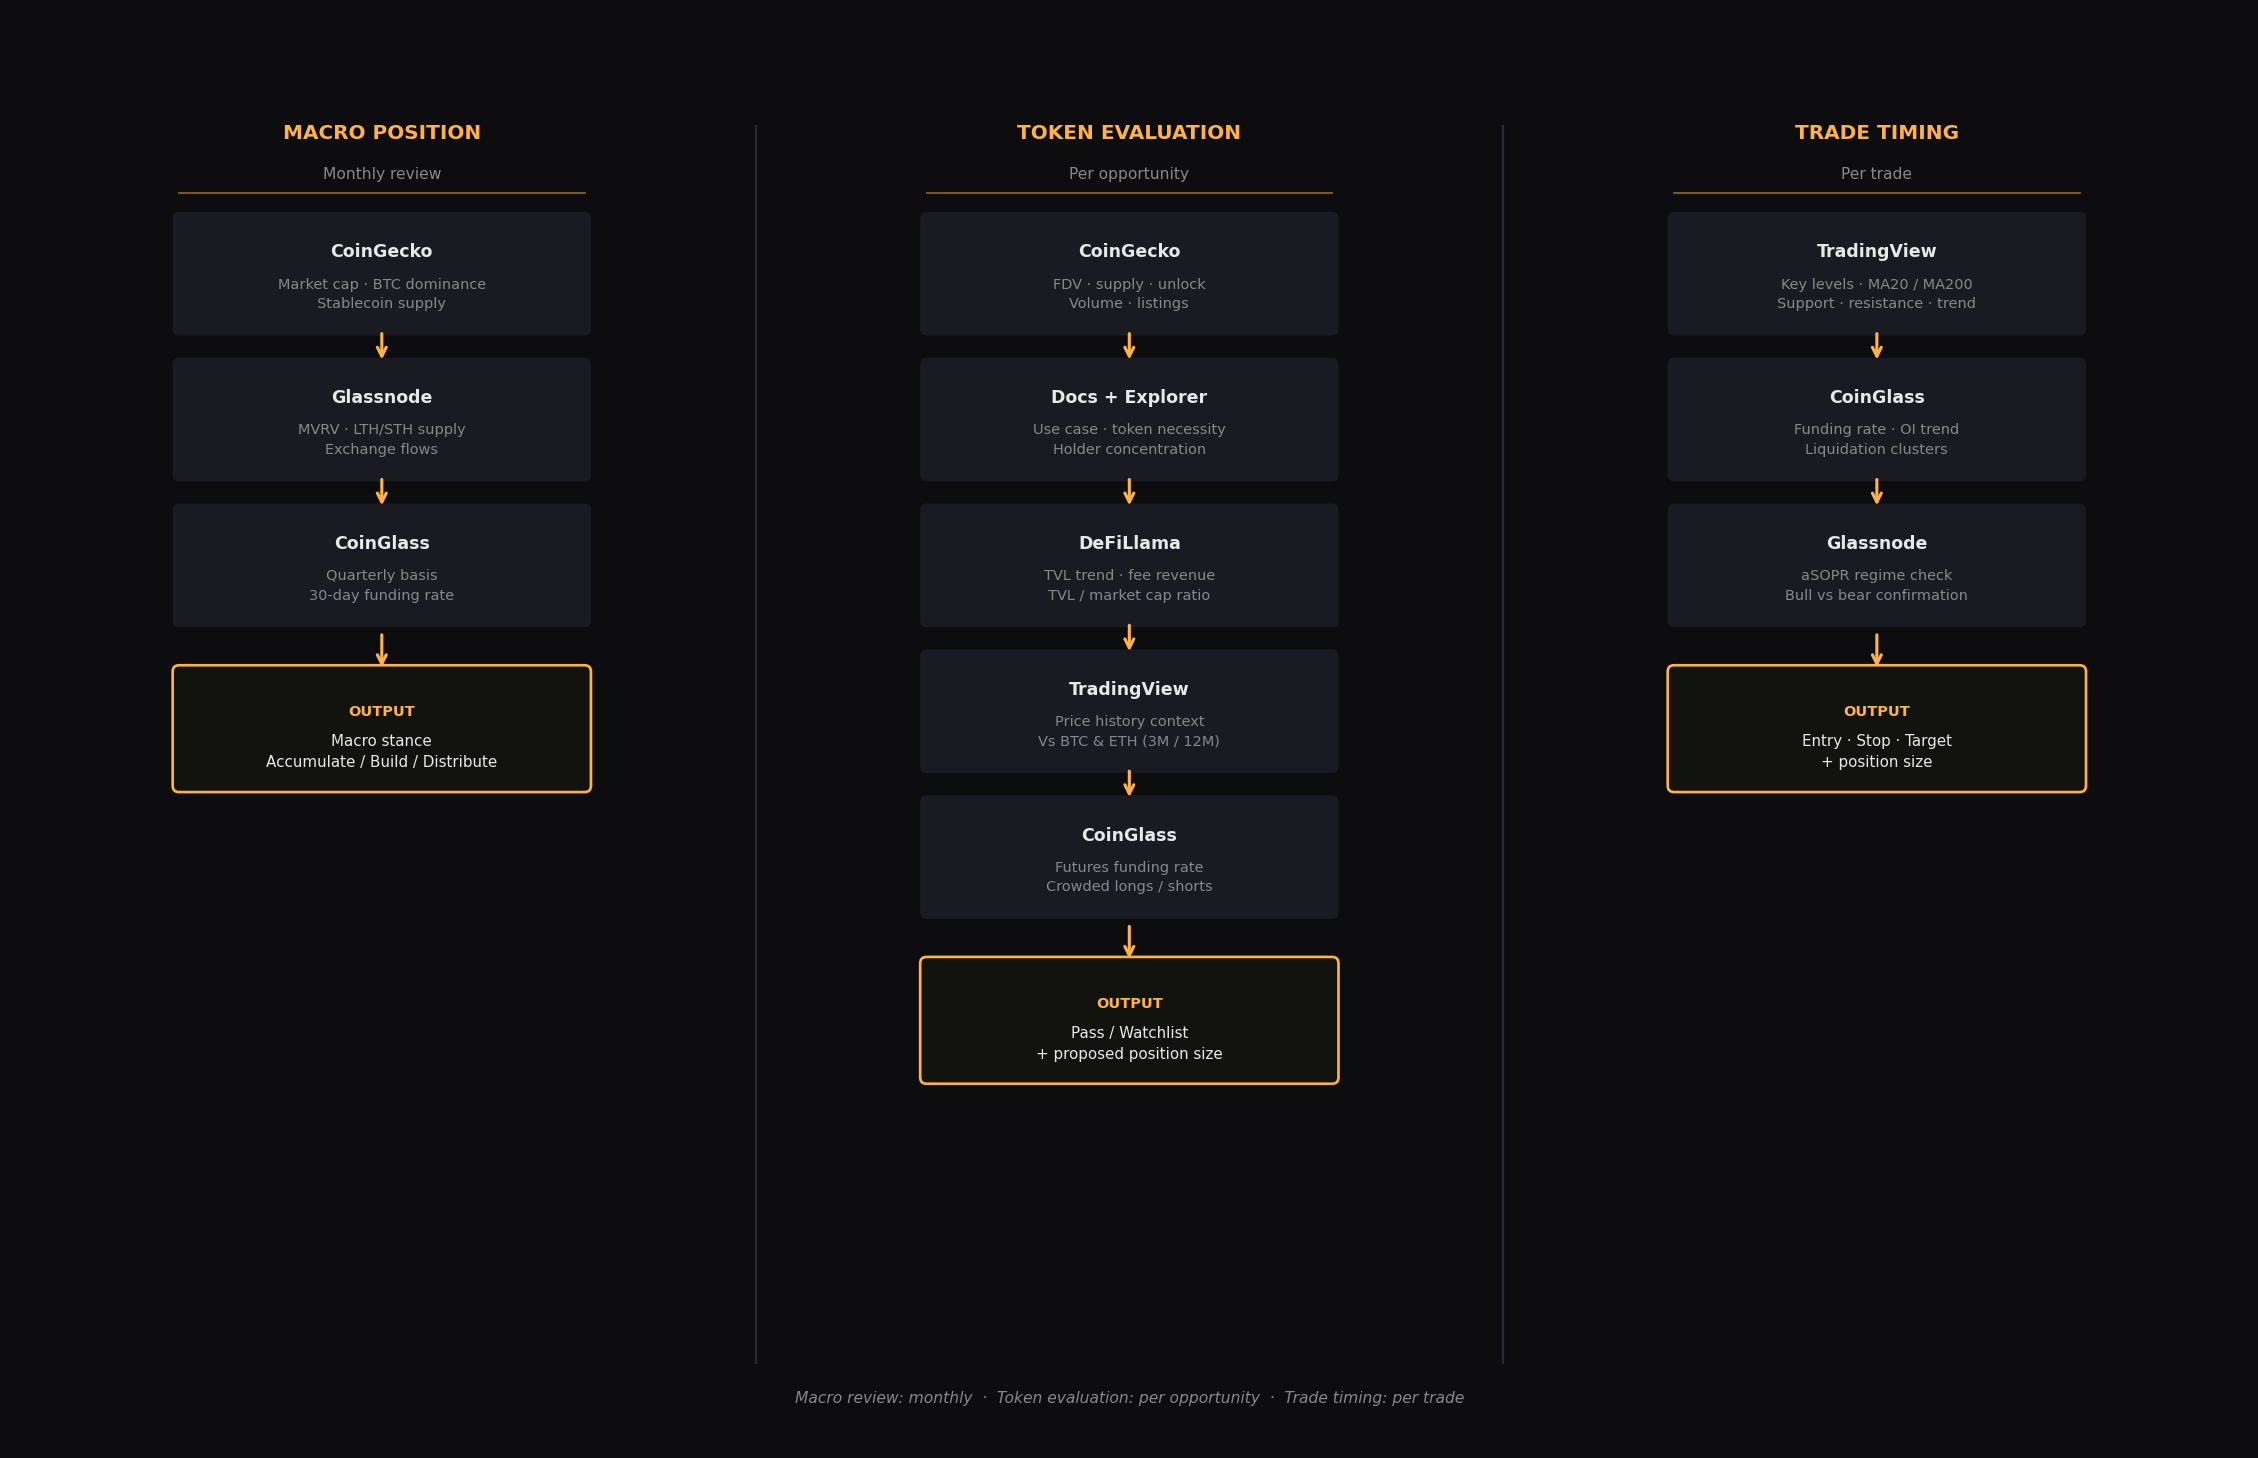
- Macro positioning (monthly): CoinGecko for market structure → Glassnode for cycle indicators → CoinGlass for derivatives sentiment → one macro stance as output
- Token evaluation (per opportunity): CoinGecko → documentation → chain explorer → DeFiLlama → TradingView → CoinGlass → Pass / Watchlist / Research complete
- Trade timing (per trade): TradingView for technical structure → CoinGlass for derivatives context → Glassnode aSOPR for regime confirmation → entry, stop, target
- Divergences between tools are the most valuable signals — on-chain bullish but derivatives bearish, or market cap rising while TVL falls, are conditions that warrant smaller position sizing and more patience
- Separate the cadences: macro monthly, token research per opportunity, timing per trade — checking everything daily produces noise, not signal