
Introduction
TradingView is the dominant charting and analysis platform for professional and active traders. With over 50 million users, cross-asset coverage spanning crypto, equities, forex, futures, and commodities, and a scripting language that supports fully custom indicators and strategies, it has become the industry standard for technical analysis work — regardless of which market you trade.
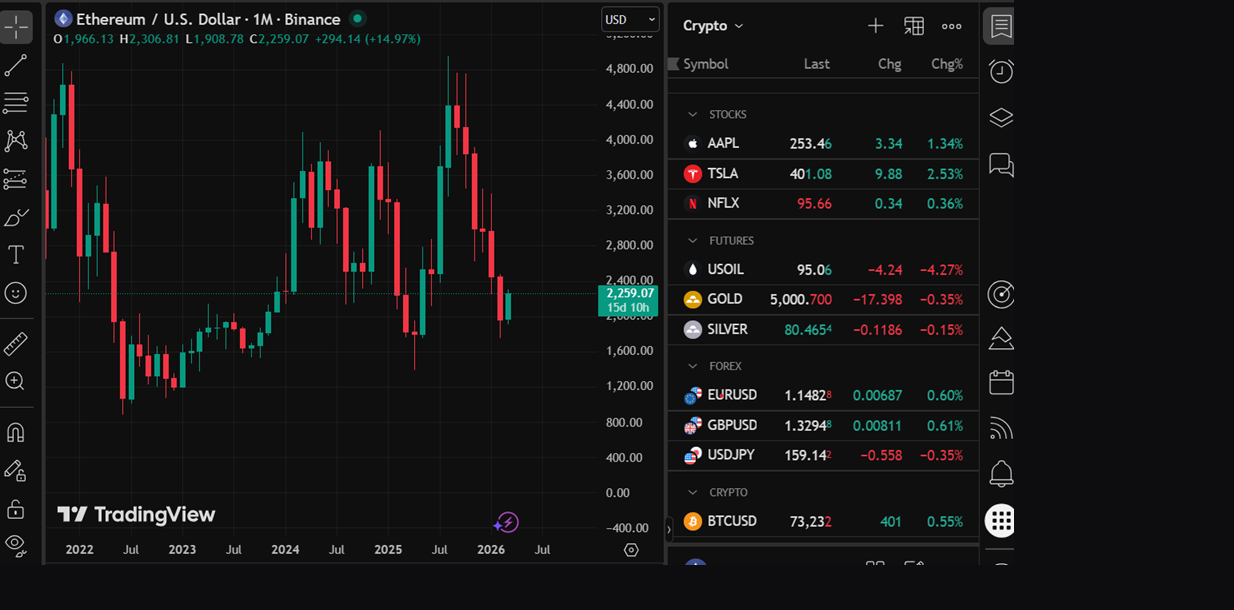
For TradFi professionals moving into crypto, TradingView is the natural bridge: the same interface you use to chart EUR/USD or S&P 500 futures works identically for BTC perpetuals, altcoin spot markets, and on-chain-derived data. There is no separate tool to learn. The workflow transfers directly.
Affiliate disclosure: links to TradingView on this page are affiliate links. We receive a commission if you subscribe through them, at no cost to you. Our assessment is independent — see our affiliate policy.
Why TradingView, Not a Built-In Exchange Chart
Every exchange has a built-in chart. TradingView exists because exchange charts are built for order entry, not analysis. The difference in practical terms:
| Capability | TradingView | Exchange Built-In Chart |
|---|---|---|
| Cross-asset comparison | Any two instruments on the same chart — BTC vs Gold, ETH vs Nasdaq | Single exchange, single asset |
| Custom indicators | Full Pine Script language — 100,000+ community scripts available | Fixed built-in indicators only |
| Multi-timeframe analysis | Unlimited layouts, sync multiple charts | One timeframe per chart |
| Alerts | Price, indicator, drawing, and script-based alerts across any instrument | Price alerts only, single exchange |
| Historical data | Deep tick data on most instruments | Varies, often limited |
| Strategy backtesting | Full built-in backtesting engine via Pine Script | Rarely available |
The practical implication: TradingView is where analysis happens. Execution happens on your exchange. These are two different tools with two different jobs.
Core Features
Chart Types and Timeframes
TradingView supports every standard chart type — candlestick, bar, Heikin Ashi, Renko, Point & Figure, Range, and more. Timeframes range from one second to monthly, with custom intervals on paid plans. For crypto traders, the availability of sub-minute and custom timeframes is a meaningful upgrade over most exchange charts.
Built-In Indicators
Over 100 built-in indicators cover the standard technical analysis toolkit: moving averages, RSI, MACD, Bollinger Bands, VWAP, Volume Profile, Ichimoku, and Fibonacci tools. The indicators behave identically regardless of the asset class — the same VWAP setup used on equity futures applies directly to BTC.
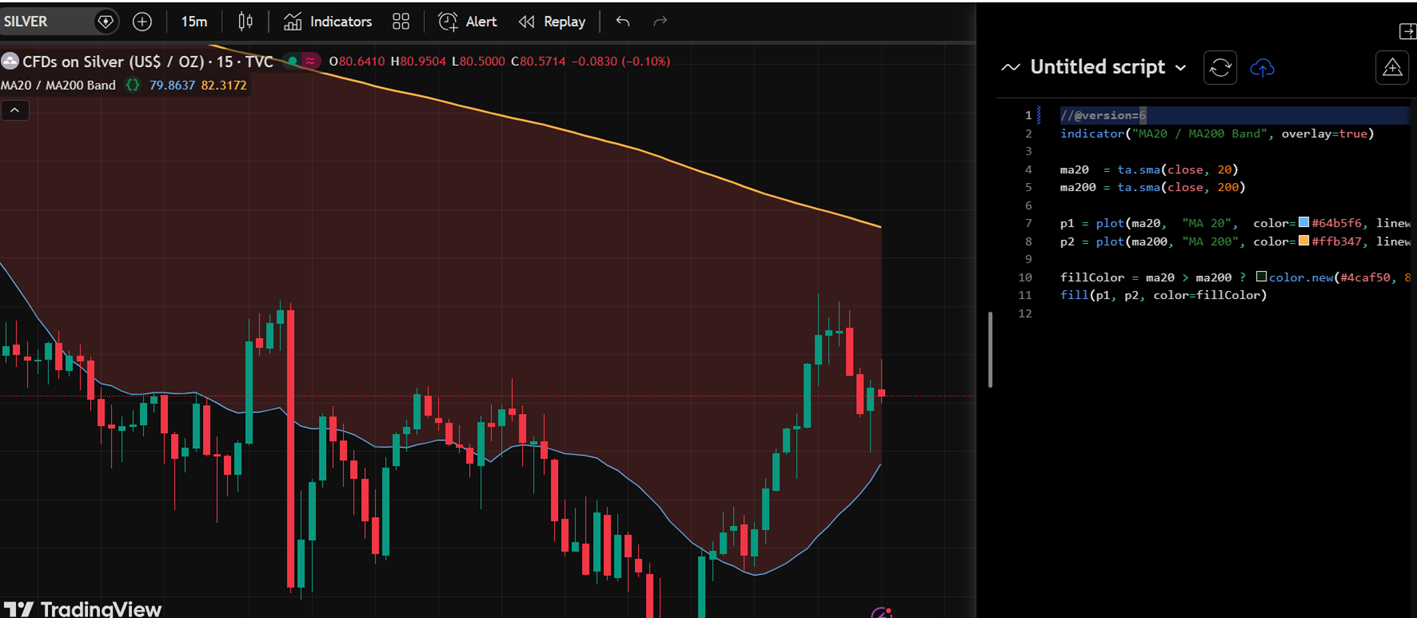
Pine Script — Custom Indicators and Strategies
Pine Script is TradingView’s proprietary scripting language. It allows you to write custom indicators and strategy backtests directly in the browser. You do not need to be a developer to use it — the syntax is straightforward and the community library contains scripts for nearly any established technical concept.
For systematic traders, Pine Script backtesting is a practical first-pass validation tool. It is not a substitute for a proper backtesting framework (Python, vectorbt, etc.) but it is fast, accessible, and sufficient for initial idea filtering.
Alerts
TradingView’s alert system is one of its most practically useful features. Alerts can be set on:
- Price levels — straightforward cross above or below
- Indicator values — e.g. RSI crossing 70, EMA crossover
- Drawing tools — trendline, support/resistance level crosses
- Pine Script conditions — any custom condition defined in a script
Alerts fire via in-app notification, email, or webhook. Webhook delivery is available on paid plans and is the standard method for connecting TradingView alerts to automated execution systems — a common setup for algo traders who want to signal from TradingView and execute on Hyperliquid or another exchange via API.
Plans and Pricing
TradingView offers a free tier with meaningful limitations, and four paid tiers. The relevant differences for serious traders:
| Feature | Free | Essential | Plus | Premium | Ultimate |
|---|---|---|---|---|---|
| Indicators per chart | 5 | 10 | 25 | 50 | 100 |
| Charts per layout | 1 | 2 | 4 | 8 | 10 |
| Alerts | 1 | 20 | 100 | 400 | 1,000 |
| Saved chart layouts | 1 | 5 | 10 | Unlimited | Unlimited |
| Intraday data history | Limited | Standard | Extended | Full | Full |
| Custom timeframes | No | No | Yes | Yes | Yes |
| Ads | Yes | No | No | No | No |
| Webhook alerts | No | No | Yes | Yes | Yes |
For most active traders, Plus is the practical minimum. It removes ads, enables webhook alerts (critical for any algo workflow), supports multiple chart layouts, and allows custom timeframes. Essential is sufficient if you primarily use single-chart setups and have no webhook requirement. Premium adds meaningfully more alert capacity and saved layouts for traders who run systematic multi-asset surveillance.
Cross-Asset Coverage Relevant to TradFi Professionals
One of TradingView’s strongest features for the TradFi audience is the breadth of data it aggregates:
| Asset Class | Coverage |
|---|---|
| Crypto (spot) | All major pairs across Binance, Coinbase, Kraken, Bybit and others |
| Crypto (perpetuals) | Binance, Bybit, Hyperliquid, OKX perpetual futures |
| US Equities | Full NYSE and Nasdaq coverage, pre/post-market data on paid plans |
| Equity Indices | S&P 500, Nasdaq, Russell, DAX, Nikkei and others |
| Forex | Full major and minor pairs via multiple data providers |
| CME Futures | BTC and ETH CME futures — critical for basis monitoring |
| Commodities | Gold, silver, crude oil, natural gas and agricultural futures |
| Fixed Income | US Treasury yields across the curve |
The ability to plot BTC against the 10-year Treasury yield, CME basis, or S&P 500 in a single layout — without leaving the platform — is the kind of cross-asset flexibility that exchange-native tools cannot provide.
Who Should Use TradingView
| Use Case | Recommendation |
|---|---|
| Active trader doing technical analysis across multiple assets | Strong recommendation — the industry standard for a reason |
| TradFi professional monitoring crypto alongside traditional markets | Strong recommendation — cross-asset in a single interface |
| Algo trader wanting to trigger execution from chart signals | Recommended — webhook alerts connect directly to exchange APIs |
| Systematic trader backtesting ideas before building a full model | Suitable — Pine Script backtesting is a fast first-pass filter |
| Occasional chart viewer, no regular analysis workflow | Free tier is sufficient — paid plan only makes sense with consistent use |
| Institutional traders building production-grade systems | Partial — TradingView is the analysis layer; production execution requires dedicated infrastructure |
Key Takeaways
- TradingView is the industry-standard platform for charting and technical analysis — cross-asset, browser-based, and used by millions of professional and active traders globally
- For TradFi professionals moving into crypto, it is the natural bridge — the same interface covers equities, forex, commodities, and crypto with no context switching
- Pine Script enables custom indicators and strategy backtesting directly in-browser, with a 100,000+ community library available as a starting point
- Webhook alerts (Plus and above) are the standard integration point for algo traders connecting chart signals to exchange execution APIs
- The free tier is functional for casual use; Plus is the practical minimum for active traders who need multi-chart layouts, custom timeframes, and webhook alerts
- CME futures coverage enables basis monitoring — an important data point for any trader tracking the relationship between spot, perps, and regulated futures markets