
Introduction
Most crypto losses do not come from bad timing. They come from buying tokens without understanding what you are buying — a project with no real users, a tokenomics structure designed to enrich insiders, or a narrative that has already peaked by the time it reaches retail. The information to avoid these mistakes is publicly available. Most people simply do not know where to look or what questions to ask.
This article presents a structured 30-minute research routine for evaluating any new token. It is not a scoring model or a checklist of boxes to tick — it is a framework for forming an opinion on four questions that matter: What does this project actually do? Who holds the tokens? Is anyone using it? And is the market pricing in reality or narrative?
The routine draws on CoinGecko for market data, on-chain explorers for holder and transaction data, DeFiLlama for protocol usage, and the project’s own documentation. No paid tools are required.
The Four Questions
Every token research session should answer four questions. If you cannot answer all four, the research is incomplete.
- What does the project do, and does it solve a real problem?
- Who holds the tokens, and what are their incentives?
- Is anyone actually using it?
- Is the current valuation reasonable relative to usage and comparable projects?
The 30-minute routine below addresses each question in sequence.
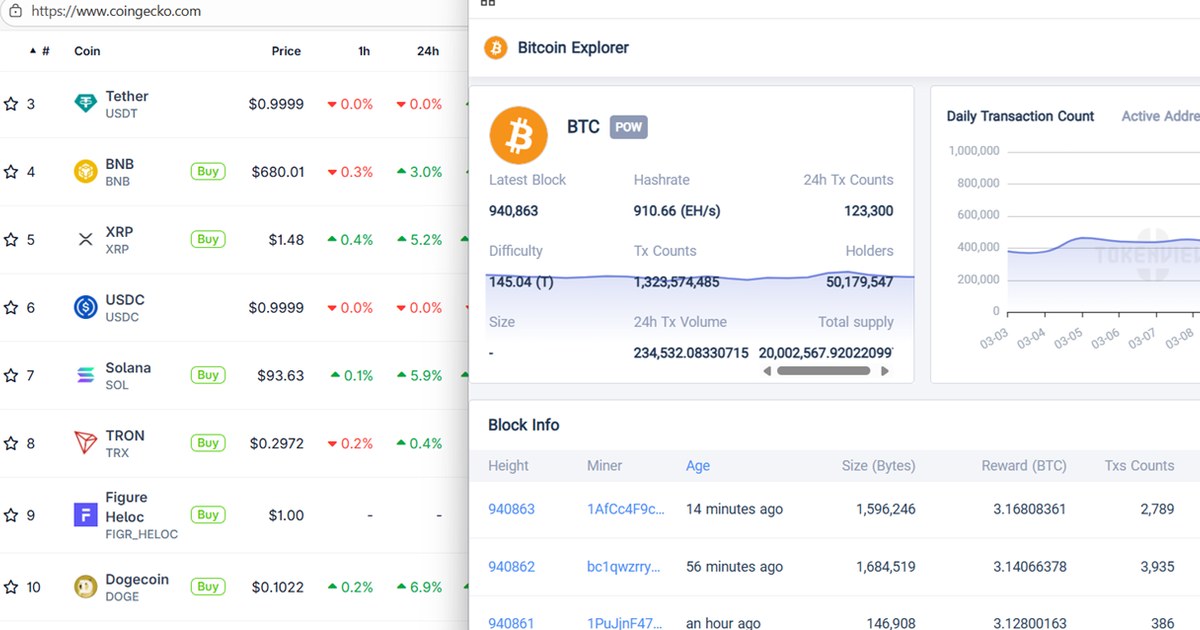
Step 1 — CoinGecko (5 minutes): Market Structure and Basics
Start with the CoinGecko token page. You are not looking at price — you are establishing the market structure facts.
What to check:
| Data Point | What to look for | Red flag |
|---|---|---|
| Market cap vs Fully Diluted Valuation (FDV) | How large is the gap? | FDV more than 5× market cap — large token unlock overhang ahead |
| Circulating supply vs max supply | What % of tokens are in circulation? | Below 20% circulating — most tokens not yet released; heavy dilution risk |
| Token unlock schedule | When do team/VC tokens vest? | Large cliff unlocks in next 3–6 months — insider selling risk |
| Exchange listings | CEX and DEX listed? | Only on obscure DEXes — low liquidity, high slippage risk |
| Trading volume vs market cap | Volume/market cap ratio | Below 1% daily volume/market cap — illiquid; above 50% — potentially wash-traded |
The FDV/Market Cap gap — the most important number
If a token has a market cap of $500 million but an FDV of $5 billion, it means 90% of the total token supply has not yet entered circulation. Each unlock event is a potential sell event by insiders who received tokens at near-zero cost. A high FDV/market cap ratio is not necessarily fatal — but it means buyers at the current market cap are competing with future sellers who have no cost basis.
Check CoinGecko’s tokenomics tab or the project’s documentation for the unlock schedule. Cliff unlocks (where a large tranche of tokens vests all at once) are the most dangerous — look for any large unlocks within the next six months.
Step 2 — Project Documentation (5 minutes): What It Actually Does
Go to the project’s website and whitepaper. You are looking for a clear answer to one question: what specific problem does this solve, and for whom?
A useful heuristic: if you cannot explain what the project does in two sentences after reading the documentation, the project either does not have a clear use case or is deliberately obscuring it.
Positive signals: – A specific, identifiable user group (e.g. DeFi traders, NFT creators, enterprise supply chain managers) – A technical mechanism that is meaningfully different from existing solutions – Evidence of real partnerships or integrations — not memoranda of understanding, but live deployments
Warning signals: – Vague language about ”revolutionising” or ”disrupting” without specifics – A token that exists primarily to fund the team rather than to serve a functional role in the protocol – A roadmap that is several years out with no working product
Ask whether the token is necessary for the protocol to function. If the protocol would work identically without the token, the token is extracting value from users rather than creating it.
Step 3 — On-Chain Explorer (10 minutes): Who Holds It and Is Anyone Using It
This is the step most retail analysts skip — and where the most revealing information sits. Use Etherscan (Ethereum), Solscan (Solana), or the appropriate chain’s explorer.
Holder distribution
Navigate to the token’s holder list. You are looking at two things:
Concentration: what percentage of supply do the top 10 wallets hold? Above 50% in the top 10 non-exchange wallets is a significant concentration risk — a small number of wallets can move the market.
Wallet types: are the large holders labelled exchanges (where high concentration is expected and benign) or unlabelled wallets (where high concentration is a risk)? An unlabelled wallet holding 10–20% of supply is a major red flag — it may be a team wallet or early investor that is not disclosed in the tokenomics.
| Holder Concentration (top 10, excl. exchanges) | Assessment |
|---|---|
| Below 30% | Reasonably distributed — healthy |
| 30–50% | Moderate concentration — monitor large wallet activity |
| 50–70% | High concentration — significant insider or whale risk |
| Above 70% | Extreme concentration — avoid or treat as very high risk |
Transaction activity
Look at the token’s transaction history for the last 30 days. You are checking:
- Transaction count: is the network being used regularly? A token with 50 transactions per day has no meaningful user base.
- Unique addresses transacting: is it a small number of wallets cycling tokens between each other (potential wash trading or artificial activity) or a broad distribution of unique users?
- Transaction pattern: does activity spike only around price moves and then go quiet? Organic usage is relatively steady; speculative activity is spiky and correlated with price.
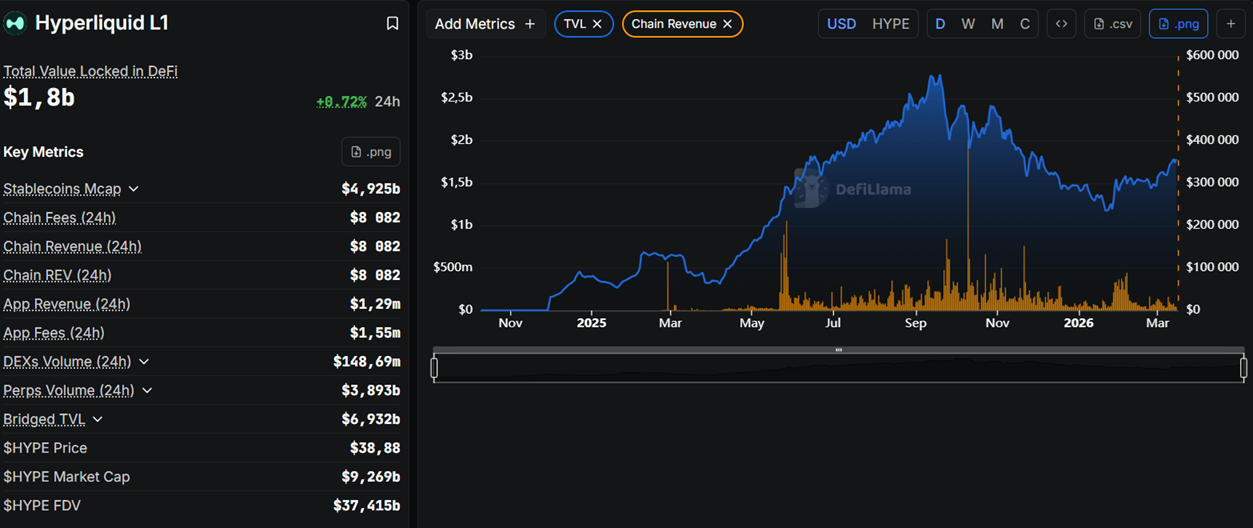
Step 4 — DeFiLlama (5 minutes): Protocol Usage for DeFi Tokens
If the token is associated with a DeFi protocol (DEX, lending protocol, yield aggregator, bridge), DeFiLlama provides the clearest picture of actual usage.
Key metrics:
Total Value Locked (TVL): the dollar value of assets deposited in the protocol. Higher TVL indicates more trust and usage — but check the trend, not just the current level. A TVL that has fallen 80% from its peak is a different proposition from one at all-time highs.
Revenue: does the protocol generate actual revenue from users, or does it rely on token incentives to attract deposits? A protocol with real revenue (fees paid by users for using the service) has a fundamentally different business model than one subsidising usage with token emissions.
TVL vs market cap ratio: a useful valuation sanity check. If a protocol has $100 million TVL and a $1 billion market cap, the market is paying 10× TVL — implying strong future growth expectations. Compare this ratio with comparable protocols in the same category.
Step 5 — Valuation Context (5 minutes): Is the Price Rational?
After establishing what the project does and whether anyone is using it, the final step is context on valuation. The goal is not to calculate a precise fair value — that is not possible — but to assess whether the current price requires heroic assumptions to justify.
For DeFi protocols: compare the price-to-fees ratio (market cap divided by annualised protocol fee revenue) with comparable protocols. A ratio of 50× is reasonable for a high-growth protocol; a ratio of 500× requires the project to grow dramatically to justify the current price.
For infrastructure tokens (L1s, L2s): compare market cap with daily active addresses, transaction count, and developer activity (GitHub commits). A chain with 10,000 daily active addresses and a $5 billion market cap is priced for a very different future than one with 500,000 daily active addresses at the same valuation.
For narrative tokens (AI, gaming, RWA): narrative tokens are priced on expectation rather than current usage. The key question is not whether the current price is justified by fundamentals (it rarely is) but whether the narrative has more room to run or whether it has already been fully priced in. Check when the narrative entered the mainstream crypto media cycle — early narratives have more upside; fully-distributed narratives are closer to their peak.
Synthesising the Research — Forming a View
After 30 minutes, you should be able to answer the four questions and place the token in one of three categories:
Pass — do not invest: the project fails on a fundamental level (no use case, extreme concentration, large unlock overhang in the near term, no real usage despite existing for more than a year).
Watchlist — monitor but do not buy yet: the project has genuine potential but a specific concern prevents action now (large cliff unlock in 3 months, TVL falling but team actively building, narrative not yet mainstream).
Research complete — size and time the entry: the project passes the fundamental checks. Now apply the market structure tools covered elsewhere in Tactics (cycle positioning, derivatives sentiment, technical levels) to determine sizing and timing.
| Question | Source | Time |
|---|---|---|
| Market structure — FDV, supply, unlocks | CoinGecko | 5 min |
| Use case — what problem, for whom | Project website / whitepaper | 5 min |
| Holder distribution and transaction activity | Etherscan / Solscan / chain explorer | 10 min |
| Protocol usage — TVL, revenue, trend | DeFiLlama | 5 min |
| Valuation context vs comparable projects | CoinGecko + DeFiLlama combined | 5 min |
Key Takeaways
- The four questions that matter: what does it do, who holds it, is anyone using it, and is the valuation rational — if you cannot answer all four, the research is incomplete
- The FDV/market cap gap is the single most important number on CoinGecko — a large gap means future token supply will compete with current buyers; cliff unlocks in the next 3–6 months are the immediate risk
- On-chain holder data reveals what tokenomics documents do not — extreme concentration in unlabelled wallets is a red flag that no whitepaper will disclose
- Transaction activity is the best proxy for real usage — steady, broad-based activity across unique addresses is organic; spiky activity correlated with price is speculative
- DeFiLlama’s revenue view separates protocols with genuine product-market fit from those subsidising usage with token emissions
- Research conclusion is one of three outputs: Pass, Watchlist, or Research complete — the third triggers market structure and timing analysis, not an immediate buy