Where Traditional Finance Meets the Blockchain
Structured, evidence-based analysis for investment bankers, portfolio managers and quants entering crypto.
No hype. No price predictions.
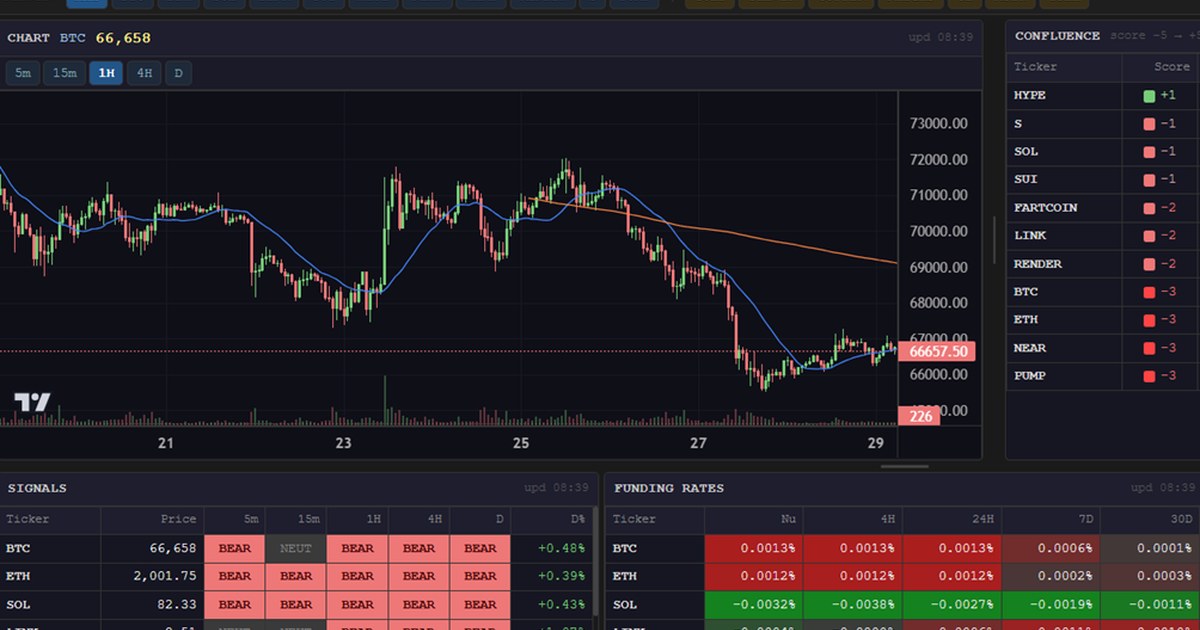
Live Signal Matrix + OI Velocity — 19 Assets, Real-Time Data
Track trend signals, funding rates and open interest velocity across crypto and macro assets in real time. MA-based signals across five timeframes give a structured view of momentum. OI Δ4H shows whether new positions are being added or closed — combined with price change over the same window to flag divergences: rising OI into falling price signals weak longs, falling OI into rising price signals a squeeze setup.
View live signals →Funding Rate Arbitrage — Live Carry Yield
When longs pay shorts on Hyperliquid perpetuals, the yield flows to whoever is on the other side. Track the current annualised carry yield across five major assets — positive yield means the market is positioned bullish, negative means the opposite. A direct read on derivatives positioning, updated every five minutes.
View arbitrage signals →Signal Strategy — Trend and Funding, Live on the Dashboard
A trend signal tells you direction. A funding rate tells you how crowded that direction already is. The combination produces materially better entries — distinguishing a fresh trend with room to run from an overextended move where the market is already positioned against you. Four setups, one framework, applicable across all 18 tracked assets.
Read the guide →