
Introduction
In traditional equity markets, sector rotation is well documented: capital moves from defensives to cyclicals as the economy expands, and back again as it contracts. Crypto has its own version of this rotation — faster, more extreme, and structured around a clear risk hierarchy that repeats across cycles.
Understanding the rotation sequence does not tell you when to buy a specific token. It tells you which category of asset is most likely to be in its outperformance window — and which categories are likely to underperform even in a bull market if you are positioned in them too early or too late.
This is one of the most actionable frameworks in crypto. Getting the rotation right — being in BTC early, rotating into ETH at the right time, and catching the altcoin phase before it reverses — is the structure behind most of the best-performing crypto portfolios across multiple cycles.
The Rotation Hierarchy
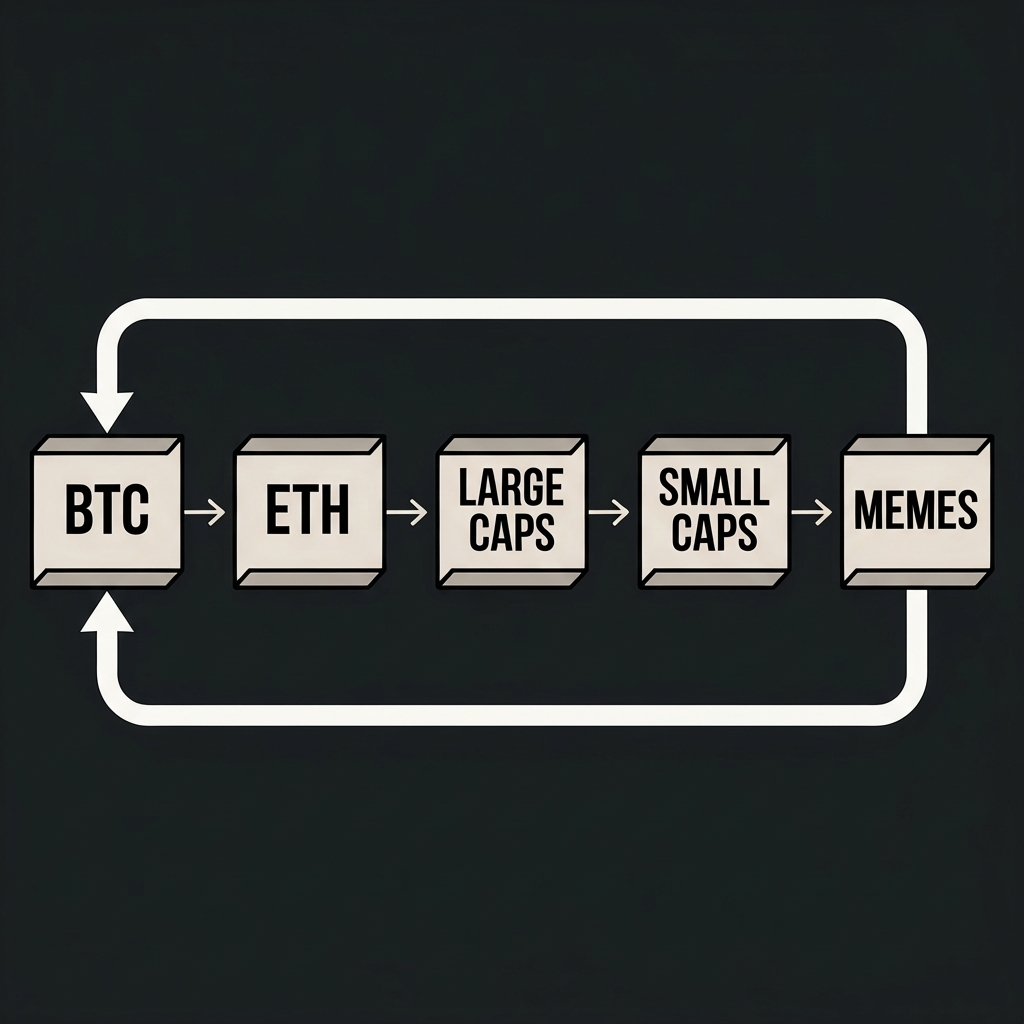
Crypto assets can be grouped into a risk hierarchy based on liquidity, market cap, institutional familiarity and volatility. Capital flows through this hierarchy in a consistent sequence during bull markets — from the most liquid and familiar to the most speculative.
| Tier | Assets | Characteristics | Typical Bull Market Phase |
|---|---|---|---|
| Tier 1 | Bitcoin (BTC) | Highest liquidity, institutional grade, lowest volatility within crypto | Leads the bull market — first to move, first to recover from corrections |
| Tier 2 | Ethereum (ETH) | Second-largest, DeFi foundation, institutional exposure via ETFs | Follows BTC with a lag of weeks; outperforms once BTC trend is established |
| Tier 3 | Large-cap alts (SOL, BNB, LINK, SUI and other top-20 assets) | Established projects, real revenue or usage, high liquidity | Second rotation wave — typically after ETH has already outperformed BTC |
| Tier 4 | Mid-cap alts (top 20–100) | Smaller projects, more speculative, less liquid | Third wave — higher risk, higher potential returns, requires active management |
| Tier 5 | Small caps, meme coins, new launches | Highly speculative, often no fundamentals, extreme volatility | Final phase — highest percentage gains concentrated here, closest to cycle top |
The sequence is not perfectly clean — there is overlap between phases, and individual assets within each tier can break the pattern significantly. But the broad capital flow from Tier 1 to Tier 5 is one of the most consistent patterns in crypto market history.
Phase 1 — The Bitcoin Phase
Every crypto bull market begins with Bitcoin. The reasons are structural, not arbitrary.
Bitcoin is the asset that institutional capital buys first. It is the most liquid, the most regulated, the most covered by traditional financial media, and the easiest to defend to an investment committee. When new capital enters crypto — whether from retail investors or institutional allocators — it routes into BTC first.
What this looks like on charts: TOTAL rising, BTC Dominance rising or holding steady, ETHBTC falling (ETH underperforming BTC), altcoins largely flat or slightly declining in BTC terms.
Duration: historically 3–9 months from the cycle bottom before the first major rotation begins.
The mistake to avoid: rotating into altcoins too early in this phase. A common pattern is for traders who missed the BTC move to chase altcoins hoping they will ”catch up” — but in Phase 1, altcoins typically continue underperforming BTC even as they rise in USD terms. The opportunity cost is significant.
Phase 2 — The Ethereum Rotation
The first rotation signal in every cycle has been the ETHBTC pair bottoming and beginning to trend upward. Ethereum starts outperforming Bitcoin — not because BTC is falling, but because capital that has been parked in BTC begins rotating into the next risk tier.
Why Ethereum specifically? ETH is the natural second step in the risk hierarchy. It is large enough for institutional position sizing, has real underlying utility (the DeFi and NFT ecosystems run on Ethereum’s rails), and is now accessible via regulated ETFs in major markets. It is the altcoin that is easiest to justify to a risk committee.
What this looks like on charts: TOTAL still rising, BTC Dominance beginning to decline, ETHBTC turning upward, Total2 beginning to outperform TOTAL.
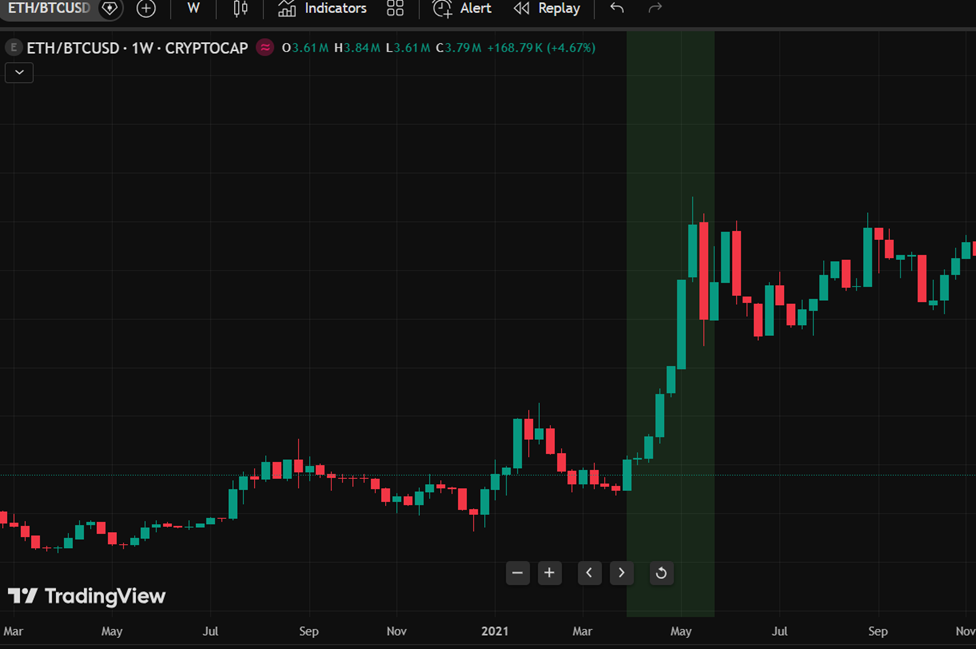
The trigger to watch: a weekly close on ETHBTC above a key resistance level after an extended period of underperformance. This is one of the most watched signals among professional crypto traders.
Duration: typically 2–5 months. ETH outperformance of BTC rarely lasts the entire bull market — it is a rotation phase, not a permanent regime change.
Phase 3 — Large-Cap Altcoin Season
Once Ethereum has established its outperformance trend, capital continues down the risk hierarchy into the established large-cap altcoin ecosystem. These are protocols with real usage, revenue and brand recognition: Solana, Chainlink, Avalanche, Uniswap and others in the top 20 by market cap.
This phase is characterised by narrative-driven performance. Each cycle has its dominant narratives — in 2021 it was DeFi, NFTs and Layer 2 scaling. In the current cycle, narratives around AI tokens, restaking, and real-world asset tokenisation have driven outsized performance in specific sectors.
Identifying the leading narrative: look for which sectors are generating the most developer activity, venture capital investment and media coverage six to twelve months before prices move. Narratives almost always have a fundamental basis — the speculation follows real development.
| Cycle | Dominant Narrative(s) | Best Performing Sector |
|---|---|---|
| 2017 | ICOs, smart contract platforms | New L1s (ETH, NEO, ADA) |
| 2020–2021 | DeFi summer, NFTs, Layer 2 | DeFi tokens, NFT platforms, Polygon |
| 2024–2025 | AI tokens, restaking, RWA, perp DEXs | AI-adjacent tokens, LRTs, Hyperliquid |
What this looks like on charts: BTC Dominance declining through the 45–50% range, Total3 beginning to outperform Total2, narrative-specific altcoins generating 3–10x returns from their cycle lows.
Phase 4 — The Speculative Tail
The final phase of every bull market is a broad-based rally that reaches assets most investors would never allocate to seriously. Meme coins, newly launched tokens with no revenue, projects that are effectively jokes — these generate the largest percentage gains of any cycle phase, and they do so precisely because serious analysts are not buying them.
The dynamic is simple: by this point in the cycle, the easy money has already been made in BTC, ETH and the leading large-caps. Participants searching for higher returns are forced further down the risk spectrum. Liquidity and attention flow into increasingly speculative assets, creating self-reinforcing price moves.
This phase is the most dangerous to participate in and the most tempting. Returns are visible everywhere — anyone holding meme coins is showing extraordinary gains. The fear of missing out is at its peak. The distance to the cycle top is measured in weeks, not months.
Signals that Phase 4 has started: – BTC Dominance below 40% and still falling – Total3 significantly outperforming Total2 on a weekly basis – Meme coins appearing in trending tokens lists across multiple platforms simultaneously – New token launches reaching $1B+ market cap within days of listing – Social media dominated by screenshots of extraordinary percentage gains
Sector Rotation Within Altcoins
Beyond the BTC → ETH → alts hierarchy, there is a secondary rotation that happens within the altcoin universe itself. Different sectors lead at different points in the cycle.
Layer 1 platforms typically lead early in the altcoin phase — capital flows into the infrastructure layer first. Solana, Avalanche and competing L1s often see their largest moves before the application layer on top of them does.
DeFi and application layer tokens typically follow — as L1 prices rise, attention turns to the protocols built on them. A rising Solana brings attention to Solana-native DeFi protocols.
Derivative and speculative sectors — meme coins, AI tokens, niche narratives — tend to lead in the final phase, often disconnected from underlying fundamentals entirely.
A practical approach: identify which narrative has the strongest fundamental backing at the start of the cycle, allocate to the leading infrastructure plays in that narrative early, and gradually rotate toward more speculative exposures as the cycle matures — with progressively tighter risk management.
Rotation Signals — A Practical Checklist
Before rotating from one tier to the next, check the following:
Rotating from BTC into ETH: – ETHBTC has broken above a weekly resistance level – BTC Dominance is declining on the weekly chart – TOTAL has been in an uptrend for at least 8 weeks – BTC is up at least 50–100% from its cycle low
Rotating from ETH into large-cap alts: – ETHBTC trend is established and has been running for at least 4 weeks – BTC Dominance is below 48% and declining – Total3 is beginning to outperform Total2 – A clear narrative has emerged with identifiable leading assets
Reducing exposure in Phase 4: – BTC Dominance below 40% – Total3 outperforming Total2 by 2x or more over 30 days – Meme coins with no utility in top trending assets – MVRV Z-Score approaching or in the red zone – Funding rates persistently elevated across major exchanges
The Symmetric Reversal
The rotation also works in reverse. When the cycle turns, the order of selling mirrors the order of buying — but faster and less orderly.
Speculative small caps and meme coins collapse first, often losing 80–90% before the broader market peak. Large-cap alts follow. ETH typically underperforms BTC during the early bear phase. Bitcoin holds up longest and falls least in percentage terms.
This means that by the time Bitcoin is making new lows in a bear market, the speculative assets at the bottom of the hierarchy are already down 80–95%. Waiting for Bitcoin to confirm the bear market before reducing altcoin exposure is almost always too late.
The practical implication: watch the speculative end of the market as a leading indicator for the cycle turn. When meme coins and Tier 4 assets start making lower highs while BTC is still near its peak, the cycle is likely closer to the end than it appears.
Key Takeaways
- Capital rotates through a consistent hierarchy in every bull market: BTC → ETH → large-cap alts → mid-caps → meme coins and speculative assets
- The rotation sequence is more reliable than the timing — focus on identifying which phase is active, not on predicting exactly when each transition happens
- ETHBTC is the key signal for Phase 2; BTC Dominance falling through 45% is the key signal for Phase 3; Total3 outperforming Total2 signals Phase 4
- Each cycle has a dominant narrative — identifying it early and positioning in the leading infrastructure plays is more reliable than chasing individual token performance
- The reversal is faster and less orderly than the rally — speculative assets lead the decline, and waiting for Bitcoin to confirm the bear market means altcoin exposure is already severely impaired