
Introduction
BTC Dominance appears simple: Bitcoin’s market cap as a percentage of total crypto. In practice, it is one of the most debated metrics in crypto analysis — frequently misread, subject to structural distortions, and capable of producing false signals that trap traders who follow it mechanically.
Used correctly, it is a powerful capital flow indicator. It tells you whether risk appetite is expanding into altcoins or consolidating back into Bitcoin — and it often leads price action in both directions by days or weeks.
This article goes deeper than the basic cycle framework. It covers how to read dominance on multiple timeframes, what distorts the signal, how to use ETHBTC as a complementary tool, and how to distinguish a genuine rotation signal from a false breakout.
What Dominance Actually Measures
BTC Dominance = Bitcoin market cap / Total crypto market cap × 100
The denominator — total crypto market cap — includes every token, stablecoin, meme coin and newly launched project tracked by data aggregators. This matters more than most analysts acknowledge.
The stablecoin problem
Stablecoins (USDC, USDT, DAI and others) are included in the total market cap calculation. As stablecoin supply grows, the denominator expands — and BTC Dominance falls, even if no capital has actually rotated from Bitcoin into anything else. This is structural dilution, not a market signal.
In 2019, stablecoin market cap was under $5 billion. By early 2026 it exceeds $200 billion. This structural expansion creates a persistent downward bias in dominance readings over time — a 45% dominance reading today is not the same risk-appetite signal as a 45% reading in 2019.
The practical fix: when using dominance as a signal, focus on the direction and rate of change over a defined timeframe rather than the absolute level. A dominance reading that is falling at 2% per month is a rotation signal regardless of whether it is at 52% or 44%.
The new listing problem
Every time a new token launches and reaches sufficient market cap to be included in aggregator data, total market cap increases — diluting BTC Dominance. Large launches (new L1s, major DeFi protocols) can cause noticeable one-time drops in dominance that have nothing to do with capital rotating away from Bitcoin.
Reading Dominance on Multiple Timeframes
Different timeframes provide different signals. Most analysts make the mistake of reading dominance on a single timeframe and acting on it directly.
| Timeframe | Signal Type | Best Used For |
|---|---|---|
| Monthly | Macro cycle phase | Determining whether you are in a BTC-dominant or altcoin-dominant market regime |
| Weekly | Medium-term trend | Identifying the rotation phase — early, mid or late — and adjusting allocation |
| Daily | Short-term signal | Timing entries into specific altcoin positions when rotation is already confirmed on higher timeframes |
| 4H / 1H | Noise (mostly) | Only useful for very short-term traders; too many false signals for medium-term positioning |
The hierarchy rule: only act on a dominance signal when it is confirmed on at least two timeframes. A weekly downtrend in dominance confirmed by a daily breakdown below a key level is a meaningful signal. A daily move on its own often reverses within 48 hours.
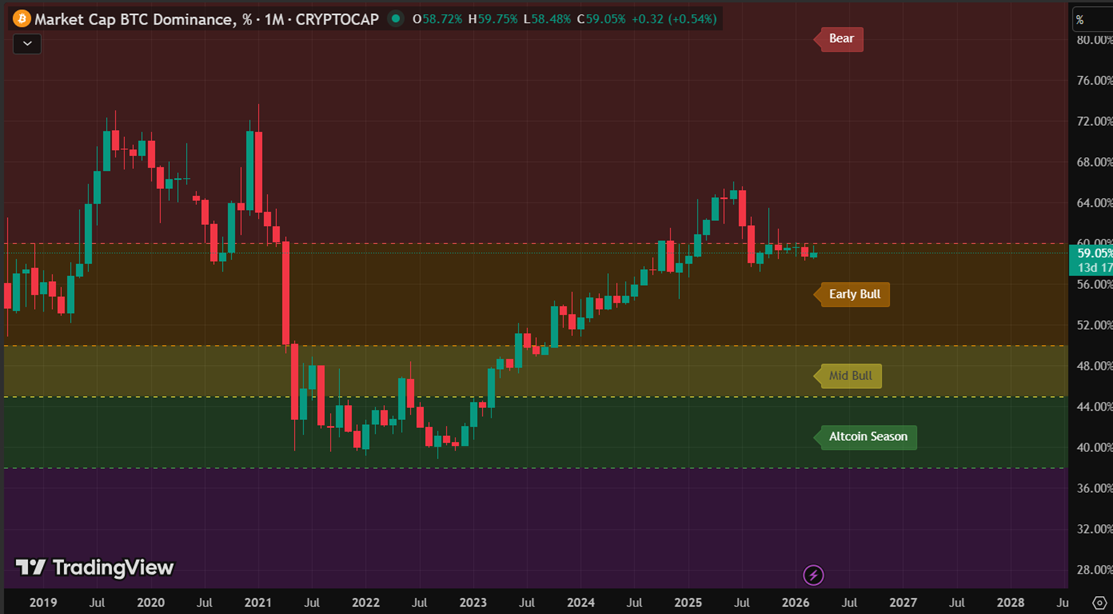
Key Levels and What They Have Meant Historically
While absolute levels are less reliable than direction, certain dominance zones have acted as significant thresholds across multiple cycles.
| Dominance Zone | Historical Context | What It Has Typically Preceded |
|---|---|---|
| Above 60% | Deep bear market, institutional accumulation phase | Prolonged BTC outperformance; altcoins continue underperforming |
| 50–60% | Bear-to-bull transition or early bull market | BTC-led rally; ETH begins catching up; altcoins largely flat |
| 45–50% | Mid bull — rotation beginning | ETH outperforms; large-cap altcoins begin moving; first rotation trades |
| 38–45% | Late bull — active altcoin season | High-beta altcoins and memes generating largest % gains; highest risk environment |
| Below 38% | Peak speculative frenzy (rare) | Historically close to cycle tops; sharp dominance reversal often follows within weeks |
Divergences — The Most Actionable Signal
The highest-quality signals from BTC Dominance come not from the trend itself but from divergences — situations where dominance and Bitcoin price are moving in opposite directions.
Bullish divergence for altcoins
Setup: Bitcoin price is rising but BTC Dominance is falling (or flat).
Reading: Capital is flowing into crypto broadly — Bitcoin is going up, but altcoins are going up more. This is the cleanest confirmation of active rotation. Altcoin positioning at this point is supported by both rising absolute prices and a favourable relative trend.
Bearish divergence — the warning signal
Setup: Bitcoin price is rising but BTC Dominance is also rising.
Reading: Bitcoin is outperforming the broader market. Capital may be entering crypto but routing specifically into BTC, not into the ecosystem broadly. This often occurs early in a bull market (institutional buying of BTC before altcoin exposure) or — more dangerously — late in a cycle when capital is consolidating before a broader risk-off move.
The danger signal
Setup: Bitcoin price is flat or falling, and BTC Dominance is rising sharply.
Reading: Altcoins are falling faster than Bitcoin. This is the classic bear market signal — capital consolidating into the relative safety of BTC, or leaving the market entirely. When this pattern appears on a weekly chart, it is one of the strongest signals to reduce altcoin exposure.
ETHBTC — The Rotation Confirmation Chart
BTC Dominance tells you whether capital is moving toward or away from Bitcoin relative to everything else. The ETHBTC pair — Ethereum’s price expressed in Bitcoin terms — tells you specifically whether the rotation is into Ethereum or into the broader altcoin tail.
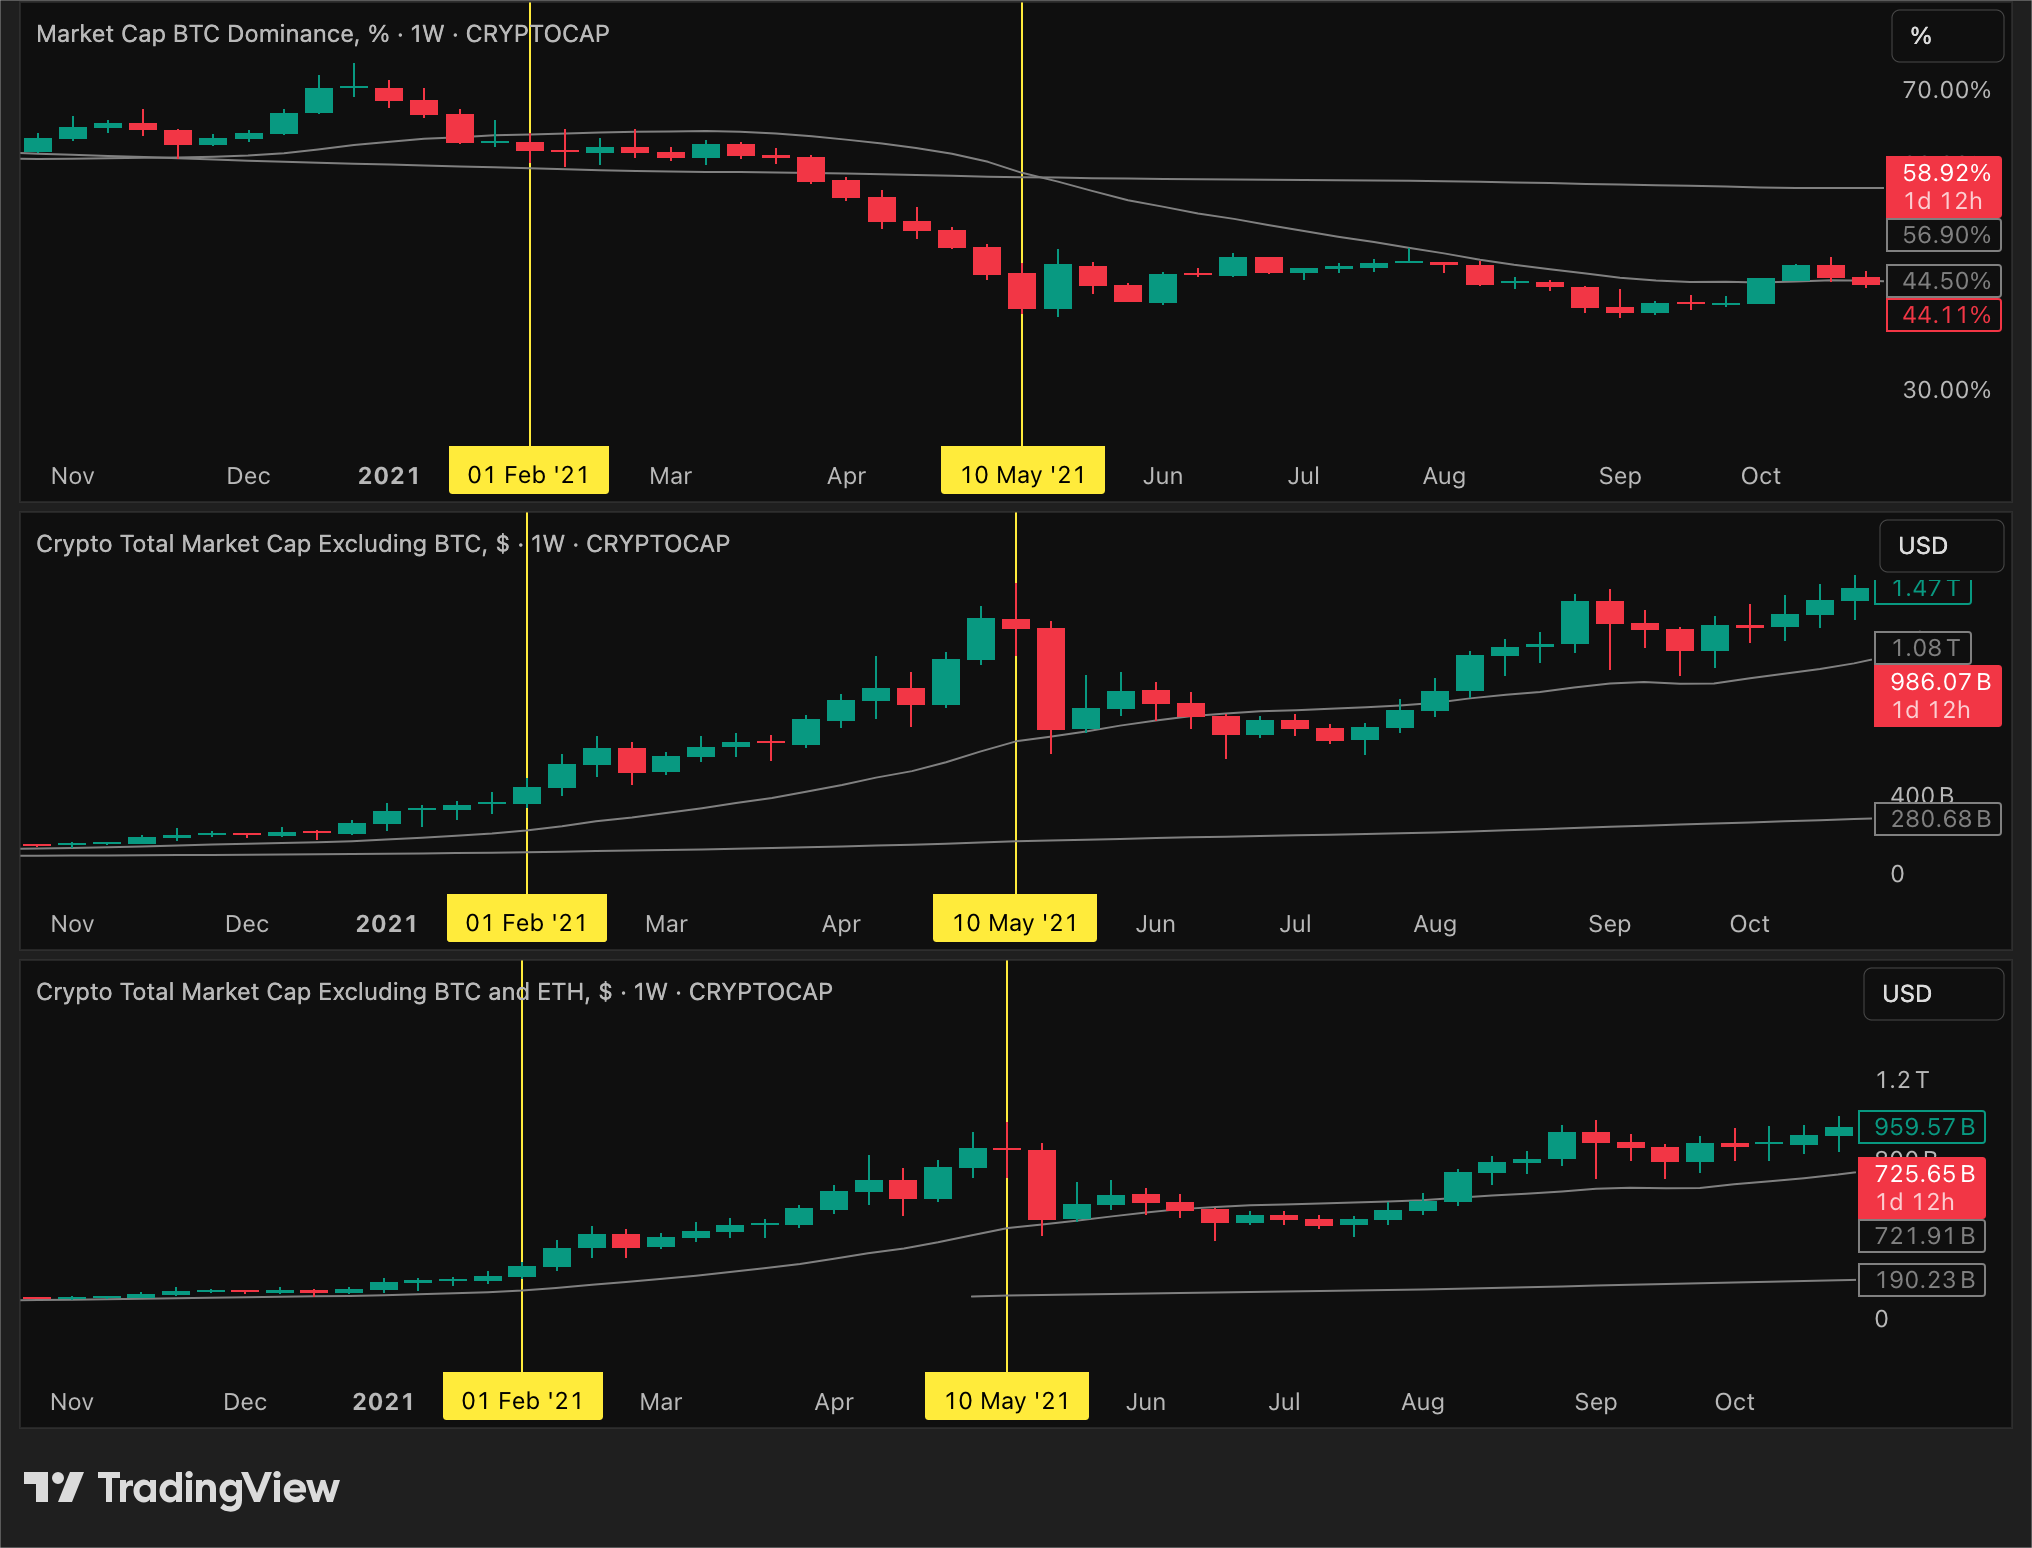
How to use ETHBTC alongside BTC Dominance
When BTC Dominance is falling and ETHBTC is rising simultaneously, the rotation signal is confirmed. Capital is moving into Ethereum specifically — not just ”away from Bitcoin” in the statistical sense caused by new token launches or stablecoin expansion.
When BTC Dominance is falling but ETHBTC is also falling, dig deeper. The dominance decline is being driven by other altcoins, not Ethereum. This can indicate late-cycle conditions where capital has already rotated past Ethereum into smaller assets.
| BTC Dominance | ETHBTC | Reading |
|---|---|---|
| Falling | Rising | Clean rotation into ETH — high conviction altcoin environment |
| Falling | Flat | Rotation into mid/small cap alts; ETH not leading |
| Falling | Falling | Late cycle speculative phase — ETH underperforming the long tail |
| Rising | Rising | ETH outperforming BTC but both outperforming altcoins — selective rotation |
| Rising | Falling | Full risk-off — BTC outperforming everything; reduce altcoin exposure |
False Signals — When Dominance Misleads
Dominance produces false signals in several recurring situations. Knowing when not to act on it is as important as knowing when to act.
1. Post-crash recovery bounces. After a sharp market-wide selloff, BTC typically falls less than altcoins (or recovers faster). Dominance spikes — but this does not necessarily signal a new BTC-dominant regime. It may simply reflect the mechanical fact that altcoins are more volatile. Wait for the signal to persist for multiple weeks before acting on it.
2. Major altcoin launch weeks. A high-profile token launch that adds $5–10B to total market cap in a week will visibly suppress dominance. Filter these events out — they are supply additions, not capital rotations.
3. Stablecoin inflow surges. When traders exit positions and park in stablecoins on-chain, total market cap increases (stablecoins are included) even though risk appetite is actually falling. Dominance can decline even as sentiment deteriorates.
4. Range-bound markets. In a choppy, sideways market, dominance often oscillates without a clear trend. Acting on every small movement produces losses. Wait for a clear trend on the weekly before allocating based on a dominance signal.
A Practical Checklist Before Acting on a Dominance Signal
Before changing your allocation based on BTC Dominance, work through these five checks:
- Is the signal confirmed on the weekly chart? Daily signals without weekly confirmation have a poor track record.
- Is ETHBTC confirming the direction? If dominance says rotate into alts but ETHBTC is falling, the signal is mixed.
- Has total market cap (TOTAL) been rising for at least 4 weeks? Rotating into altcoins in a falling overall market is high risk regardless of dominance.
- Is there a structural reason for the dominance move? (New token launch, stablecoin expansion) If yes, discount the signal.
- What does open interest and funding data say? If altcoin futures are already at extreme funding rates, the rotation trade may be crowded.
Key Takeaways
- BTC Dominance is most useful as a directional indicator — the trend and rate of change matter more than the absolute level
- Structural factors (stablecoin expansion, new token launches) create persistent downward bias — always adjust for context
- The most actionable signals are divergences between dominance and BTC price, not the dominance trend alone
- ETHBTC is the essential companion chart — it confirms whether rotation is into Ethereum specifically or into the broader altcoin tail
Reading the Crypto Market Cycle →
Sector Rotation — The Capital Flow Sequence →
- False signals are common in post-crash recoveries, range-bound markets and weeks with major token launches — use a multi-timeframe confirmation approach before acting