
Introduction
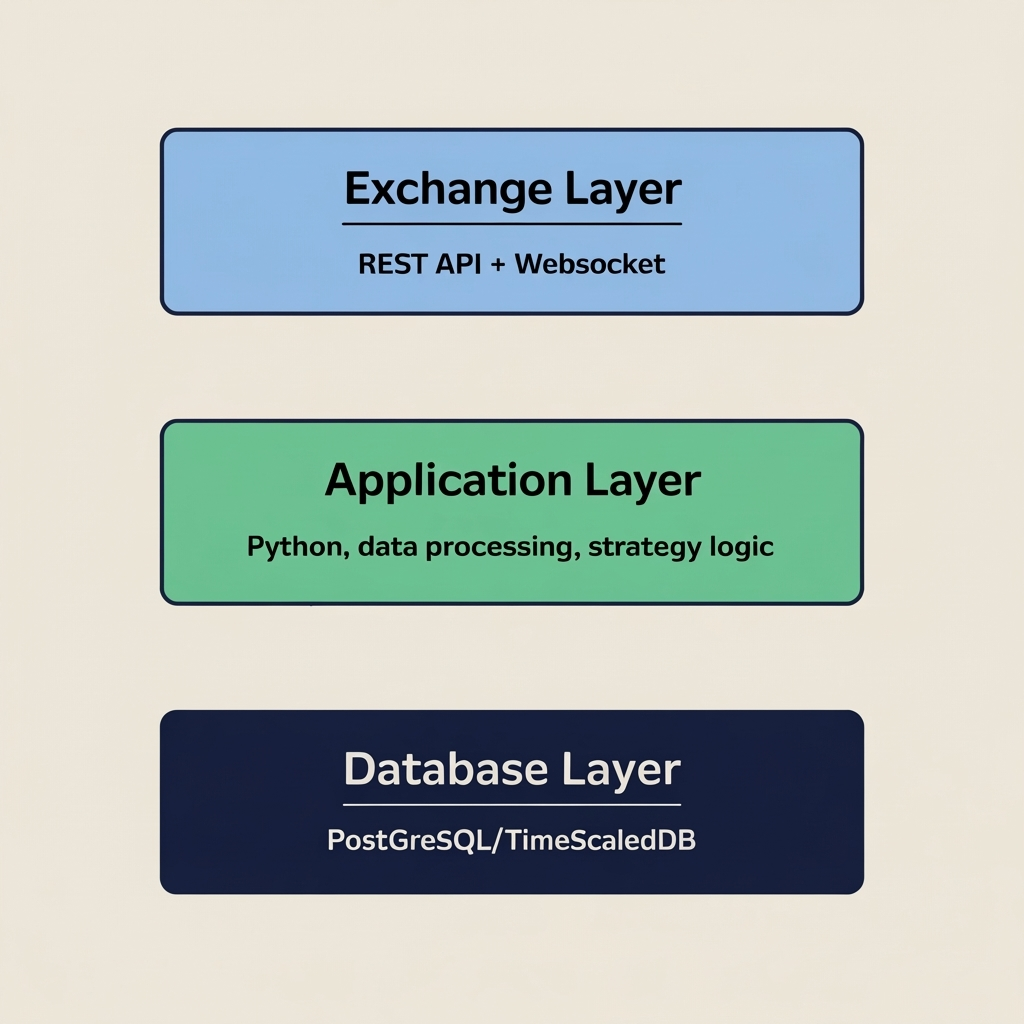
The most capable algo traders are not just using pre-built tools. They are building their own — connecting directly to exchange APIs, storing data in their own database, and reading live prices through WebSocket streams. The result is a fully controlled stack: you decide what data you store, how fast you receive it, and what your application does with it.
This page walks through the core building blocks of a self-built trading application: how to connect to a DeFi exchange API, how to save historical price data to a time-series database, and how to consume live market data in real time. Along the way, we build toward a complete picture of what the full application looks like and how all the pieces connect.
The examples use Python, PostgreSQL with TimescaleDB, and the Hyperliquid API — but the patterns transfer directly to other exchanges and other databases.
Part 1 — Connecting to a DeFi Exchange API
How DeFi Exchange APIs Work
Most DeFi perpetual exchanges — Hyperliquid, Lighter, Apex and others — expose two types of API endpoints:
REST API — standard HTTP request/response. You send a request, you get a response. Used for fetching historical data, placing orders, checking balances and reading account state. Simple and stateless: each request is independent.
WebSocket API — a persistent, two-way connection. The exchange pushes data to you continuously without you having to ask repeatedly. Used for real-time prices, order book updates, and trade confirmations. Essential for anything that needs to react quickly to market movements.
Both types are openly accessible — no special broker relationship required. You authenticate using an API key generated in your exchange account.
Fetching Historical OHLCV Data (REST)
Historical candlestick data (OHLCV: Open, High, Low, Close, Volume) is the foundation of any backtesting or indicator calculation. Most exchanges provide a REST endpoint that returns a list of candles for a given symbol and timeframe.
Here is an example using the Hyperliquid API:
import requests
import time

def fetch_ohlcv(symbol: str, interval: str, start_ms: int, end_ms: int) -> list:
    """
    Fetch historical OHLCV candles from Hyperliquid.
    interval: "5m", "15m", "1h", "4h", "1d"
    start_ms / end_ms: Unix timestamps in milliseconds
    """
    url = "https://api.hyperliquid.xyz/info"
    payload = {
        "type": "candleSnapshot",
        "req": {
            "coin": symbol,
            "interval": interval,
            "startTime": start_ms,
            "endTime": end_ms,
        }
    }
    response = requests.post(url, json=payload, timeout=10)
    response.raise_for_status()
    return response.json()


# Fetch the last 7 days of hourly BTC candles
seven_days_ms = 7 * 24 * 60 * 60 * 1000
now_ms = int(time.time() * 1000)

candles = fetch_ohlcv("BTC", "1h", now_ms - seven_days_ms, now_ms)

for c in candles[:3]:
    print(f"Time: {c['t']}  Open: {c['o']}  High: {c['h']}  Low: {c['l']}  Close: {c['c']}  Volume: {c['v']}")
The exchange returns data in chunks — typically 500 to 5000 candles per request. For longer historical periods, you loop through time windows and concatenate the results.
Placing an Order (REST)
Placing a trade via API requires authentication. DeFi exchanges typically use cryptographic signing — your private key signs each order request, proving it came from you without sending the key itself.
# Simplified example — actual signing depends on the exchange
# Hyperliquid uses Ethereum-style signing via the eth_account library

from eth_account import Account
from eth_account.messages import encode_defunct
import json, requests, time

def place_market_order(symbol: str, is_buy: bool, size: float, private_key: str):
    """Place a market order on Hyperliquid."""
    order = {
        "type": "order",
        "orders": [{
            "a": 0,          # asset index (0 = BTC)
            "b": is_buy,     # True = buy, False = sell
            "p": "0",        # price (0 = market order)
            "s": str(size),  # size
            "r": False,      # reduceOnly
            "t": {"market": {}}
        }],
        "grouping": "na"
    }
    # Sign and send (exchange-specific implementation)
    # See exchange SDK documentation for complete signing logic
    print(f"Order prepared: {'BUY' if is_buy else 'SELL'} {size} {symbol}")
In practice, most exchanges provide an official Python SDK that handles the signing for you. Using the SDK is strongly recommended over implementing signing logic from scratch.
Part 2 — Storing Data in TimescaleDB
Why TimescaleDB
TimescaleDB is a PostgreSQL extension designed specifically for time-series data. It gives you the full power of SQL — joins, aggregations, complex queries — while adding optimisations that make storing and querying millions of price rows fast and practical.
For a trading application, it is an excellent choice:
- Standard SQL — no new query language to learn
- Automatic partitioning — data is split by time internally, making range queries on dates very fast
- Compression — older data is compressed automatically, keeping storage costs low
- Retention policies — you can configure data to expire after a set period
- Works with any PostgreSQL tool — pgAdmin, DBeaver, any Python library that speaks SQL
A lightweight alternative is SQLite for simpler setups — a single file, no server needed, good for development and small-scale strategies. For production, PostgreSQL/TimescaleDB is the right choice.
Setting Up the Database
Run TimescaleDB in Docker — the simplest way to get a fully functional setup running locally in minutes:
docker run -d \
  --name timescaledb \
  -p 5432:5432 \
  -e POSTGRES_PASSWORD=yourpassword \
  timescale/timescaledb:latest-pg16
Then connect and create your tables:
-- Connect to the database and enable the TimescaleDB extension
CREATE EXTENSION IF NOT EXISTS timescaledb;

-- Create the OHLCV price table
CREATE TABLE IF NOT EXISTS ohlcv (
    datetime    TIMESTAMPTZ   NOT NULL,
    ticker      TEXT          NOT NULL,
    timeframe   TEXT          NOT NULL,
    open        NUMERIC,
    high        NUMERIC,
    low         NUMERIC,
    close       NUMERIC,
    volume      NUMERIC
);

-- Convert to a TimescaleDB hypertable (partitioned by time)
SELECT create_hypertable('ohlcv', 'datetime', if_not_exists => TRUE);

-- Index for fast lookups by ticker and timeframe
CREATE INDEX IF NOT EXISTS idx_ohlcv_ticker_tf
    ON ohlcv (ticker, timeframe, datetime DESC);
Saving Candles to the Database
Once you have fetched historical data from the exchange, insert it into TimescaleDB:
import psycopg2
from datetime import datetime, timezone

def save_candles(candles: list, ticker: str, timeframe: str, conn):
    """Insert OHLCV candles into TimescaleDB."""
    cursor = conn.cursor()
    rows = [
        (
            datetime.fromtimestamp(c["t"] / 1000, tz=timezone.utc),
            ticker,
            timeframe,
            float(c["o"]),
            float(c["h"]),
            float(c["l"]),
            float(c["c"]),
            float(c["v"]),
        )
        for c in candles
    ]
    cursor.executemany(
        """
        INSERT INTO ohlcv (datetime, ticker, timeframe, open, high, low, close, volume)
        VALUES (%s, %s, %s, %s, %s, %s, %s, %s)
        ON CONFLICT DO NOTHING
        """,
        rows,
    )
    conn.commit()
    cursor.close()
    print(f"Saved {len(rows)} candles for {ticker} ({timeframe})")


# Connect and save
conn = psycopg2.connect(
    host="localhost", port=5432,
    dbname="trading", user="postgres", password="yourpassword"
)
save_candles(candles, ticker="BTC", timeframe="1h", conn=conn)
ON CONFLICT DO NOTHING ensures that re-running the loader does not create duplicate rows — important for incremental updates.
Querying Your Data
With data in the database, you can query it using standard SQL from Python:
import pandas as pd

def load_ohlcv(ticker: str, timeframe: str, days: int, conn) -> pd.DataFrame:
    """Load recent OHLCV data into a pandas DataFrame."""
    query = """
        SELECT datetime, open, high, low, close, volume
        FROM ohlcv
        WHERE ticker = %s
          AND timeframe = %s
          AND datetime >= NOW() - INTERVAL '%s days'
        ORDER BY datetime ASC
    """
    return pd.read_sql(query, conn, params=(ticker, timeframe, days))

df = load_ohlcv("BTC", "1h", days=30, conn=conn)

# Calculate a 20-period moving average
df["ma20"] = df["close"].rolling(20).mean()
print(df.tail(5))
Part 3 — Real-Time Prices via WebSocket
Why WebSocket Instead of Polling
The naive approach to getting live prices is to repeatedly call a REST endpoint every second: ”give me the latest price, now give me the latest price again, now again.” This is called polling, and it has significant downsides: it creates unnecessary load on the exchange’s servers, has variable latency, and may get you rate-limited.
WebSocket connections work differently. You open a single connection to the exchange and subscribe to a data stream. The exchange then pushes new data to you the moment it becomes available — no repeated requests, no waiting. Your application receives a message and processes it immediately.
For a trading application, WebSocket is the right tool for anything that needs to respond in real time: updating a chart, triggering an alert, or feeding signals into an algorithm.
Subscribing to Live Prices
import asyncio
import websockets
import json

async def stream_prices(symbols: list[str]):
    """
    Stream real-time mid prices from Hyperliquid WebSocket.
    Prints price updates as they arrive.
    """
    uri = "wss://api.hyperliquid.xyz/ws"

    async with websockets.connect(uri) as ws:
        # Subscribe to all mid prices
        subscribe_msg = {
            "method": "subscribe",
            "subscription": {"type": "allMids"}
        }
        await ws.send(json.dumps(subscribe_msg))
        print("Connected. Waiting for price updates...")

        async for raw_message in ws:
            msg = json.loads(raw_message)

            if msg.get("channel") != "allMids":
                continue

            mids = msg["data"]["mids"]
            for symbol in symbols:
                if symbol in mids:
                    price = float(mids[symbol])
                    print(f"{symbol}: {price:.2f}")


asyncio.run(stream_prices(["BTC", "ETH", "SOL"]))
This streams price updates for all assets simultaneously. Your callback receives a new message every time any price changes — typically several times per second for active markets.
Saving Real-Time Ticks to the Database
For high-frequency data you want to preserve, write each incoming price update to the database:
import asyncio
import websockets
import json
import psycopg2
from datetime import datetime, timezone

async def stream_and_save(symbols: list[str], conn):
    """Stream prices and write each tick to the database."""
    uri = "wss://api.hyperliquid.xyz/ws"
    cursor = conn.cursor()

    async with websockets.connect(uri) as ws:
        await ws.send(json.dumps({
            "method": "subscribe",
            "subscription": {"type": "allMids"}
        }))

        async for raw_message in ws:
            msg = json.loads(raw_message)
            if msg.get("channel") != "allMids":
                continue

            ts = datetime.now(tz=timezone.utc)
            mids = msg["data"]["mids"]

            for symbol in symbols:
                if symbol in mids:
                    price = float(mids[symbol])
                    cursor.execute(
                        "INSERT INTO price_ticks (datetime, ticker, price) VALUES (%s, %s, %s)",
                        (ts, symbol, price)
                    )
            conn.commit()
For very high-frequency data (sub-second ticks), batch your inserts rather than committing on every message — this avoids database write bottlenecks.
Part 4 — Putting It All Together
The Full Application Architecture
A complete trading application built on these components looks like this:
┌─────────────────────────────────────────────────┐
│                  EXCHANGE                        │
│  REST API (historical, orders)  WebSocket (live) │
└────────────────┬──────────────────┬─────────────┘
                 │                  │
                 ▼                  ▼
┌────────────────────────────────────────────────┐
│              PYTHON APPLICATION                 │
│                                                 │
│  ┌─────────────┐    ┌──────────────────────┐   │
│  │  Data Loader │    │   WebSocket Feed     │   │
│  │  (REST, bulk)│    │   (real-time prices) │   │
│  └──────┬──────┘    └──────────┬───────────┘   │
│         │                      │                │
│         ▼                      ▼                │
│  ┌──────────────────────────────────────────┐   │
│  │           Strategy Engine                │   │
│  │  - reads indicators from DB              │   │
│  │  - receives live prices from WebSocket   │   │
│  │  - generates buy/sell signals            │   │
│  └──────────────────────┬───────────────────┘   │
│                         │                       │
│         ┌───────────────┴────────────┐          │
│         ▼                            ▼          │
│  ┌─────────────┐           ┌──────────────────┐ │
│  │  Order      │           │   GUI / Dashboard │ │
│  │  Execution  │           │   (manual panel + │ │
│  │  (via API)  │           │    algo signals)  │ │
│  └─────────────┘           └──────────────────┘ │
└──────────────────────┬─────────────────────────┘
                       │
                       ▼
         ┌─────────────────────────┐
         │      TimescaleDB        │
         │  ohlcv, price_ticks,    │
         │  signals, orders        │
         └─────────────────────────┘
Each layer has a clear responsibility:
- Data Loader — runs on a schedule (every 5 minutes, hourly) and keeps the database up to date with fresh candles from the exchange REST API
- WebSocket Feed — maintains a live connection to the exchange and pushes real-time prices into the application
- Strategy Engine — reads historical indicators from the database, receives the live price from the WebSocket feed, and produces signals
- Order Execution — receives signals from the strategy engine and places orders via the exchange REST API
- GUI / Dashboard — displays everything in one place: live prices, indicator values, open positions, and manual order controls
A Minimal Working Scheduler
To keep your database populated with fresh data, run a simple scheduler that fetches the latest candles at regular intervals:
import asyncio
import psycopg2
import time

TICKERS    = ["BTC", "ETH", "SOL"]
TIMEFRAMES = ["5m", "15m", "1h", "4h", "1d"]

async def update_candles(conn):
    """Fetch and save the latest candles for all tickers and timeframes."""
    now_ms = int(time.time() * 1000)
    lookback_ms = 2 * 60 * 60 * 1000  # 2 hours back

    for ticker in TICKERS:
        for tf in TIMEFRAMES:
            candles = fetch_ohlcv(ticker, tf, now_ms - lookback_ms, now_ms)
            save_candles(candles, ticker, tf, conn)

async def scheduler(interval_seconds: int = 300):
    """Run candle updates every interval_seconds."""
    conn = psycopg2.connect(
        host="localhost", port=5432,
        dbname="trading", user="postgres", password="yourpassword"
    )
    while True:
        print(f"Running update at {time.strftime('%H:%M:%S')}")
        await update_candles(conn)
        await asyncio.sleep(interval_seconds)

asyncio.run(scheduler(300))  # Update every 5 minutes
What to Build Next
Once the core data pipeline is working — REST data flowing into the database, WebSocket prices arriving in real time — you can build on top of it:
Technical indicators — calculate moving averages, RSI, ATR and other indicators using SQL window functions or pandas, and store the results back in the database for fast access by the strategy engine.
Signal generation — query the indicator table and emit buy/sell signals based on your rules. Store each signal with a timestamp so you can review the strategy’s historical decisions.
Order management — track every order placed, its fill price and outcome. Over time, this becomes your trading journal and the data source for evaluating whether your strategy is working.
A unified GUI — combine all of this into a single application window where you see live prices, current signal state, open positions and a manual order panel. This is the hybrid setup described in the Algorithmic Trading guide: full automation and manual control in the same interface.
Specific implementations of this full stack on individual exchanges — including complete code examples for Hyperliquid, Lighter and Apex — are covered in their dedicated pages.
Key Takeaways
- Exchange APIs come in two types: REST (for historical data and placing orders) and WebSocket (for real-time streaming data)
- TimescaleDB on top of PostgreSQL is the practical choice for storing time-series price data — standard SQL, fast range queries, automatic compression
- A complete trading application has four layers: data ingestion, a database, a strategy engine, and an execution/interface layer
- Start with the data pipeline first: get historical data into the database and live prices flowing through a WebSocket before writing any strategy logic
- The same architecture supports both fully automated trading and hybrid setups where algorithmic signals and manual trading coexist in one application
For a guide to algo trading strategies and the hybrid trading model, see our Algorithmic Trading page. Exchange-specific implementation guides — Hyperliquid, Lighter and Apex — are coming soon.