
Introduction
Every transaction on a public blockchain is permanently recorded and visible to anyone. This is one of the most powerful features of crypto that has no direct equivalent in traditional finance — you can watch what the largest traders, funds and market makers are actually doing, in real time, with no delay and no intermediary.
Wallet tracking is the practice of monitoring specific blockchain addresses to understand how capital is moving. When a fund buys $50 million worth of ETH, that transaction is on-chain. When a whale opens a $100 million leveraged long on a perpetual exchange, that position is visible. When tokens flow from a project’s treasury to an exchange, you can see it before any announcement is made.
Used correctly, on-chain wallet data is one of the most reliable leading indicators available in crypto markets.
Why Wallet Tracking Matters
In traditional markets, institutional order flow is largely invisible to retail participants. Dark pools, internalization and delayed reporting mean that by the time a large trade becomes public information, the price has already moved.
In crypto, the opposite is true. Large transactions are public the moment they occur. The blockchain is the tape, and anyone can read it.
This creates genuinely useful signals for traders who know what to look for:
Accumulation before a move. Large wallets — often called ”smart money” — tend to build positions before significant price appreciation. Tracking the accumulation of a token into a small number of wallets, particularly wallets with a history of profitable trades, can indicate positioning ahead of a move.
Exchange inflows as a sell signal. When tokens move from cold storage or long-term holder wallets to exchange deposit addresses, it typically indicates that the holder intends to sell. Large exchange inflows from known whale wallets are a historically reliable bearish signal for short-term price action.
Exchange outflows as a buy signal. The reverse: when tokens leave exchanges and move to private wallets, it suggests holders are withdrawing to self-custody — removing supply from immediate sell pressure. Persistent exchange outflows are often associated with accumulation phases.
VC and project wallet unlocks. Many token projects have lockup schedules for early investors and team members. When vesting periods end, tokens become liquid and can be sold. Tracking these wallet unlock events gives advance warning of potential selling pressure.
Liquidation cascades. On DeFi lending protocols, large positions approaching their liquidation price become visible on-chain. Tracking wallets with large, near-underwater positions allows you to anticipate potential cascade liquidations and the price impact that follows.
Copy trading signals. Some wallets have demonstrated consistent profitability over years — identifying them and mirroring their positions is a real strategy used by retail and systematic traders alike.
Types of Wallets Worth Tracking
Not all wallets are equally informative. The most actionable signals tend to come from a defined set of categories:
Whales — individual wallets holding very large amounts of a specific token, typically in the top 1–10 holders. Their moves carry market impact by definition.
Smart money wallets — wallets that have historically generated outsized returns: early buyers of tokens that subsequently performed well, wallets that sold before major crashes, or accounts with win rates significantly above the market average.
Exchange wallets — the hot and cold wallets of major exchanges (Binance, Coinbase, Bybit etc.) hold enormous amounts of tokens. Flows into and out of these addresses reflect aggregate market intent.
Protocol and DAO treasuries — project treasuries that hold funds in stablecoins, ETH or their own token. Large treasury outflows can indicate selling, operational spending, or protocol distress.
VC and fund wallets — venture capital firms that invested early in projects often hold tokens that unlock over time. Their wallets are frequently identified and labelled by on-chain analytics platforms.
Miner and validator wallets — relevant for proof-of-work chains like Bitcoin; miners selling their block rewards into exchanges creates predictable supply pressure.
What You Can Detect Through Wallet Tracking
| Signal | What to look for | Typical interpretation |
|---|---|---|
| Large exchange inflow | Whale sends tokens to exchange | Sell pressure likely — bearish short-term |
| Large exchange outflow | Tokens leave exchange to cold wallet | Accumulation — bullish supply signal |
| New wallet buys large position | Unknown wallet makes large purchase | Possible smart money accumulation |
| Known fund accumulates quietly | VC wallet builds position over days | Early positioning ahead of a catalyst |
| Token approaches liquidation price | Large leveraged position near threshold | Potential cascade, increased volatility |
| Treasury wallet sells | Project moves tokens to exchange | Possible sell pressure, check context |
| Top trader opens large perpetual | Profitable wallet takes directional bet | Potential directional signal |
General Wallet Tracking Platforms
Nansen
Nansen is the industry standard for institutional-grade on-chain analytics. Its core value is a database of over 250 million labelled wallet addresses — identifying known entities such as venture funds, centralised exchanges, DeFi protocols, NFT projects and high-performance traders.
Instead of watching anonymous addresses, Nansen tells you that a specific wallet belongs to a known VC firm or has historically achieved a 78% win rate on trades above $1 million. This transforms raw blockchain data into actionable intelligence.
Key features: – Smart Money dashboards — track wallets that have historically outperformed – Token God Mode — see which wallets are accumulating or distributing any specific token – Exchange flow analytics — aggregate inflows and outflows across all major exchanges – Wallet profiler — full transaction history and performance for any address – Real-time alerts for specific wallet activity
Pricing: Premium subscription required for most features. Free tier available with limited access.
Best for: Institutional and professional traders who want labelled wallet data and smart money signals.
Arkham Intelligence
Arkham focuses on deanonymisation — linking blockchain addresses to real-world entities using AI. Its database has indexed over 800 million address labels across more than 450,000 entity profiles, including exchanges, funds, projects and high-profile individuals.
Where Nansen excels at aggregated smart money signals, Arkham excels at tracing specific fund flows: where did this money come from, and where did it go? It is particularly used for on-chain investigation and understanding the ownership structure behind large wallets.
Key features: – Entity identification — AI-based linking of addresses to known organisations – Transaction graph visualisation — trace fund flows through multiple hops – Custom alerts — get notified when a specific wallet transacts – Arkham Intel Exchange — a marketplace where users buy and sell intelligence on specific wallets – Free tier with meaningful functionality
Best for: Tracing specific fund flows, identifying wallet ownership, on-chain investigation.
DeBank
DeBank is the go-to tool for quickly profiling any EVM-compatible wallet. Paste any Ethereum address and instantly see the full portfolio: every token, every DeFi position (lending, LP, staking), across all supported chains.
It is less focused on alerts and signals, and more focused on giving you a complete snapshot of what a specific wallet is doing right now.
Key features: – Full portfolio view across 40+ EVM chains – DeFi position breakdown (Aave, Uniswap, GMX etc.) – Transaction history – Wallet ranking — leaderboard of largest wallets by portfolio value – Free to use
Best for: Quickly understanding what any wallet holds and where their capital is deployed across DeFi.
Whale Alert
Whale Alert monitors on-chain transactions in real time and publishes alerts when large transfers occur — typically transactions above $500,000 to $1 million depending on the asset. It covers 10+ blockchains including Bitcoin, Ethereum, Solana, Ripple and others.
Alerts are published on X (Twitter), via a website dashboard, and through an API. It is simple and broad — not as deep as Nansen or Arkham, but useful as a real-time feed of large market movements.
Key features: – Real-time alerts for large transfers across major blockchains – Bitcoin, Ethereum, Solana, XRP and more – Free website and X feed; API available on paid plans – Identifies transfers to/from known exchange wallets
Best for: A simple, always-on feed of large transaction alerts without requiring deep analysis.
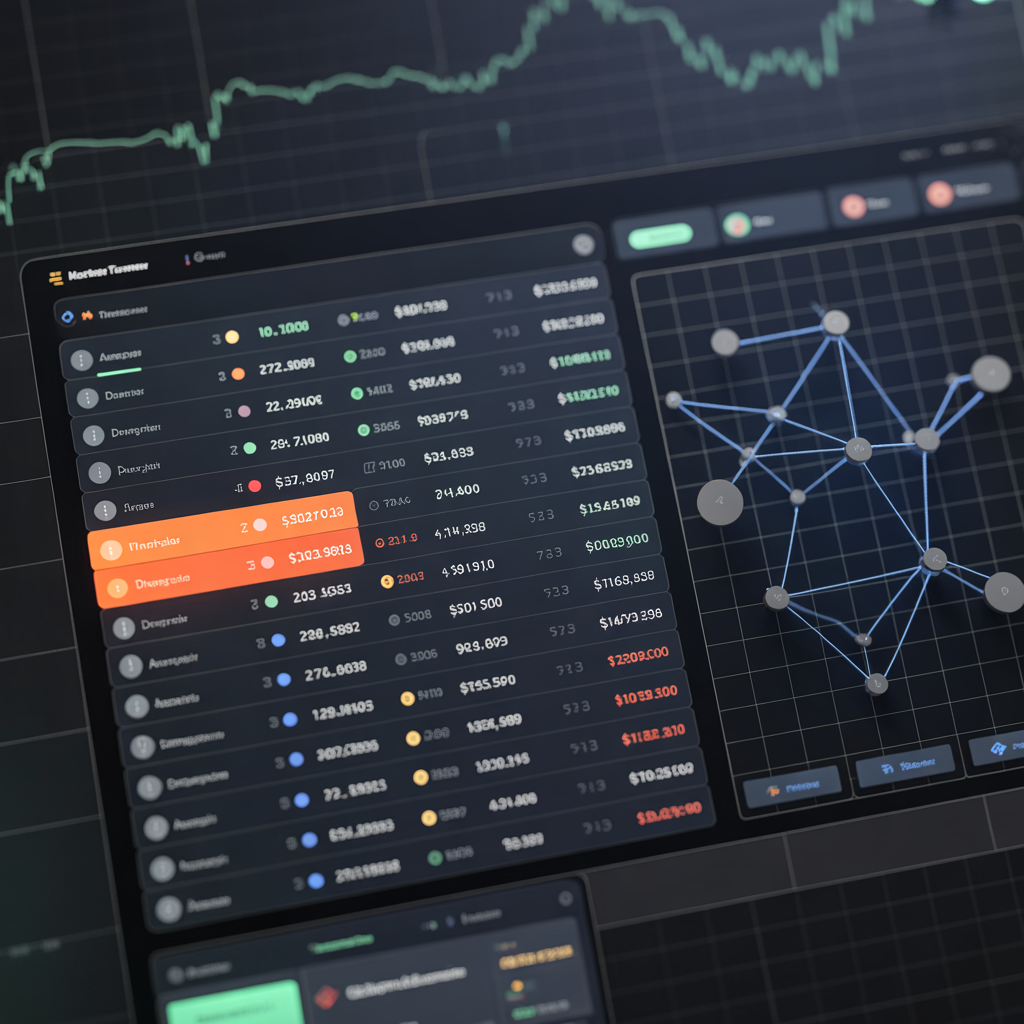
Bubblemaps
Bubblemaps specialises in visualising token holder relationships and wallet clusters. Instead of a list of addresses, it produces an interactive bubble chart showing how wallets are connected — which addresses sent tokens to which others, which wallets appear to be controlled by the same entity, and how concentrated a token’s supply really is.
This is particularly useful for evaluating new or smaller tokens — a token that appears to have 10,000 holders may actually have 90% of its supply concentrated in 50 wallets that are all connected to the same origin address, which Bubblemaps makes immediately visible.
Key features: – Visual wallet cluster analysis – Supply concentration mapping – Identify connected wallets and coordinated activity – Token holder distribution overview – Free for most features
Best for: Evaluating token supply distribution, identifying wash trading or artificial holder counts, spotting coordinated accumulation.
Dune Analytics
Dune is a SQL-based platform where anyone can query raw on-chain data across 100+ blockchains and build shareable dashboards. It is less of a pre-built tool and more of a self-service analytics layer.
The community has built thousands of public dashboards covering everything from exchange volume and DEX flows to specific protocol metrics and whale wallet activity. Many of the most useful whale-tracking dashboards on Dune are free and updated in real time.
Key features: – Full SQL access to on-chain data across 100+ chains – Thousands of community-built dashboards – Build custom queries for any on-chain metric you can define – Python and API integration for pulling data into your own tools – Free tier available
Best for: Custom analysis, building your own dashboards, accessing raw on-chain data programmatically.
Glassnode
Glassnode focuses on macro on-chain metrics rather than individual wallet tracking. It tracks aggregate signals like long-term vs short-term holder behaviour, realised profit and loss across the entire network, exchange reserves over time, and miner activity.
Where Nansen and Arkham look at specific wallets, Glassnode looks at the behaviour of the entire market as an aggregate — useful for identifying broad market cycle positioning.
Key features: – Supply in profit / loss metrics – Exchange reserve levels over time – Long-term holder vs short-term holder supply – Miner selling pressure – Funding rate and derivatives metrics
Best for: Macro on-chain cycle analysis, understanding broad market positioning rather than tracking specific wallets.
Hyperliquid-Specific Tracking Tools
Because Hyperliquid is a fully on-chain perpetual exchange, every position and trade is publicly visible — more transparency than any centralised exchange offers. A set of specialised tools has emerged specifically to monitor Hyperliquid whale activity:
CoinGlass — Hyperliquid Whale Tracker
CoinGlass provides real-time whale monitoring for Hyperliquid positions, with alerts for positions above $1 million notional value. It also includes a liquidation map showing where large positions would be liquidated at different price levels — a valuable tool for anticipating volatility.
Features: Real-time whale alerts, position size tracking, PnL by address, liquidation heatmap. URL: coinglass.com/hyperliquid
CoinAnk — Hyperliquid Large Trader Tracking
CoinAnk tracks large trader activity on Hyperliquid with real-time position and alert data, showing address-level PnL, leverage and historical performance.
HyperTracker
HyperTracker is a dedicated Hyperliquid wallet and alert companion. Add any wallet address and receive push notifications when that address opens, modifies or closes a position. Useful for following specific known traders or monitoring your own account.
Wallet Tracking Tools — Overview
| Tool | Best For | Chains | Free Tier | Key Feature |
|---|---|---|---|---|
| Nansen | Smart money signals, labelled wallets | EVM + Solana | Limited | 250M+ labelled addresses |
| Arkham | Deanonymisation, fund flow tracing | Multi-chain | Yes | AI entity identification |
| DeBank | Quick wallet portfolio snapshot | 40+ EVM chains | Yes | Full DeFi position breakdown |
| Whale Alert | Real-time large transfer alerts | 10+ chains | Yes | X/Twitter feed of big moves |
| Bubblemaps | Token supply visualisation | EVM + Solana | Yes | Wallet cluster bubble charts |
| Dune Analytics | Custom SQL on-chain queries | 100+ chains | Yes | Build any dashboard with SQL |
| Glassnode | Macro on-chain cycle metrics | BTC + ETH | Limited | Long-term holder metrics |
| CoinGlass HL | Hyperliquid whale monitoring | Hyperliquid | Yes | Liquidation map + whale alerts |
How to Use Wallet Tracking in Practice
Wallet tracking is most useful when it is part of a broader process rather than a standalone signal. Here is a practical workflow:
1. Identify wallets worth following. Start with platforms like Nansen or Arkham to find wallets with a strong track record — high win rates, large size, consistent profitability. Save these addresses.
2. Set up alerts. Use Arkham or Whale Alert to create alerts for those specific addresses. You want to know within minutes when a monitored wallet makes a significant move.
3. Cross-reference with price action. When a large wallet accumulates a token, check whether the price has already moved (in which case you may be too late) or whether the position is being built quietly over time.
4. Check exchange flows. Before entering a trade based on a whale signal, check whether large amounts of the same token are simultaneously flowing to exchanges — which would suggest selling pressure that could counteract the signal.
5. Use Hyperliquid data for directional signals. For perpetual traders, monitoring large Hyperliquid positions via CoinGlass gives real-time information about how professional traders are positioned. A concentration of large long positions at a specific price level can signal either a strong directional conviction — or a potential squeeze target if the price moves against them.
Key Takeaways
- Every blockchain transaction is public — wallet tracking gives you visibility into large market participants that has no equivalent in traditional finance
- The most actionable signals come from exchange inflows/outflows, smart money accumulation patterns, and large perpetual positions on transparent DeFi exchanges like Hyperliquid
- Nansen and Arkham are the industry standards for labelled wallet intelligence and fund flow tracing
- DeBank is the fastest way to profile any EVM wallet’s current holdings across DeFi
- Bubblemaps reveals whether a token’s supply is genuinely distributed or concentrated in connected wallets
- CoinGlass and CoinAnk provide Hyperliquid-specific whale monitoring with real-time position and liquidation data
- Wallet tracking is a signal, not a strategy — always combine it with other analysis before acting
For a guide to decentralised perpetual exchanges where on-chain positions are publicly visible, see our Perpetual Trading page. For setting up automated alerts and data pipelines from on-chain data, see our Build Your Own Trading Application page.