
Introduction
A trend signal tells you which direction the market is moving. A funding rate tells you how crowded that move already is. Used separately, each has value. Used together, they produce a materially different quality of signal — one that distinguishes between a fresh trend with room to run and an overextended move where the majority of participants are already positioned the same way you are about to be.
The framework in this article combines MA-based trend signals across multiple timeframes with funding rate data from the perpetual futures market. The core principle is straightforward: a trend signal confirmed by neutral or opposing funding is a higher-conviction entry than the same signal in a market where funding is already extreme in the same direction.
This is the logic behind the TradFiDefi Live Dashboard — which displays trend signals and funding rates side by side across 18 assets and five timeframes.
The Two Layers
Layer 1 — Trend Signals
The trend signal is derived from the relationship between price and its moving averages — MA20 and MA200. Three states are possible:
- Bullish — price is above both MA20 and MA200, and MA20 is above MA200. The trend is up on this timeframe.
- Bearish — price is below both moving averages, and MA20 is below MA200. The trend is down.
- Neutral — the conditions for bullish or bearish are not cleanly met. The market is in a transitional or range-bound state.
The signal is timeframe-specific. An asset can be bullish on the daily and bearish on the 1-hour. Multi-timeframe alignment — where the signal is the same across 1H, 4H and D — represents a stronger trend condition than a signal on a single timeframe.
Layer 2 — Funding Rates
The funding rate reflects the cost of holding a perpetual futures position. When the market is heavily long-biased, longs pay shorts a positive funding rate. When it is short-biased, shorts pay longs.
The key insight for this framework is not the direction of funding — it is the magnitude relative to a neutral baseline:
- Neutral funding (near zero) — the market has no strong directional bias in derivatives. A trend signal here has not yet been priced into positioning.
- Moderate funding (mildly positive or negative) — some directional bias exists but is not extreme. Still compatible with trend-following.
- Extreme funding — the derivatives market is heavily skewed in one direction. A trend signal in the same direction as extreme funding means you are late to a crowded trade.
Timeframe Mapping
Funding rates are measured per hour on Hyperliquid. The relevant funding window depends on the timeframe of the signal you are using:
| Signal Timeframe | Funding Window to Use | Why |
|---|---|---|
| 5min, 15min, 1H | 1-hour average funding | Short-term positioning context for intraday signals |
| 4H | 4-hour average funding | Matches the intermediate-term trend horizon |
| Daily | 24-hour average funding | Smooths out intraday funding spikes for swing signals |
This mapping avoids a common error: using a single funding snapshot to evaluate a multi-day swing signal, or using a long-term average to filter a short-term entry. The window should match the decision horizon.
The Four Combined Setups
Setup 1 — High-Conviction Trend Entry
Signal: Bullish (or Bearish) Funding: Neutral or opposing (bullish signal with near-zero or negative funding; bearish signal with near-zero or positive funding)
This is the cleanest entry condition. The trend direction is established, but the derivatives market has not yet crowded into the trade. Longs are not yet paying a significant premium to stay long. If the trend continues, position growth will add fuel rather than representing a crowded unwind risk.
How to use it: this is the condition under which trend-following entries have the best risk-reward. The signal is present; the market is not yet positioned against you.
Setup 2 — Signal Confirmed, Funding Moderate
Signal: Bullish (or Bearish) Funding: Mildly positive (for bullish) or mildly negative (for bearish)
The trend and derivatives positioning are aligned but not at an extreme. This is the typical condition during a healthy trending market — some long bias exists, but it is not a warning sign on its own.
How to use it: enter with normal sizing. Monitor funding over subsequent sessions — if it continues to climb toward extreme levels while the trend signal persists, consider tightening stops or reducing position size ahead of a potential flush.
Setup 3 — Warning: Crowded Trade
Signal: Bullish (or Bearish) Funding: Extreme in the same direction as the signal (strongly positive for bullish; strongly negative for bearish)
The trend signal is present, but the derivatives market is already heavily positioned in the same direction. Longs (or shorts) are paying a material cost to stay in the trade. This does not mean the trend is over — markets can remain overbought for extended periods — but it does mean you are entering a crowded trade late.
How to use it: reduce position size relative to your normal entry. Widen stops to give the trade room for a funding-flush before continuing. Do not add aggressively to a position in this condition. The signal is valid but the entry timing is unfavourable.
Setup 4 — Contrarian Setup
Signal: Bullish (or Bearish) Funding: Extreme in the opposite direction (bullish signal with strongly negative funding; bearish signal with strongly positive funding)
This is the highest-conviction setup in the framework. The trend signal is pointing one way while the derivatives market is heavily positioned the other way. A bullish signal with negative funding means longs are not yet crowding in — shorts are paying to maintain a trade that the trend has already started to invalidate. This is the setup that precedes sharp, accelerated moves as forced covering adds fuel to the emerging trend.
How to use it: this setup warrants larger sizing and tighter entry discipline. The combination of a confirmed trend signal and opposing extreme funding is the closest this framework produces to a high-probability entry signal.
| Signal | Funding | Setup | Action |
|---|---|---|---|
| Bullish | Near zero or negative | High-conviction entry | Full-size entry |
| Bullish | Mildly positive | Healthy trend | Normal entry, monitor funding |
| Bullish | Strongly positive | Crowded trade | Reduced size, wider stop |
| Bullish | Strongly negative | Contrarian setup | High conviction — potential for accelerated move |
| Bearish | Near zero or positive | High-conviction entry | Full-size short entry |
| Bearish | Mildly negative | Healthy downtrend | Normal entry, monitor funding |
| Bearish | Strongly negative | Crowded short | Reduced size, wider stop |
| Bearish | Strongly positive | Contrarian setup | High conviction — potential for squeeze |
| Neutral | Any | No setup | Wait — no trend to trade |
Calibrating the Threshold
What counts as ”extreme” funding depends on the asset and the broader market environment. During a bull market, persistently positive funding is normal — the threshold for what constitutes a warning signal shifts upward. During a bear market, the baseline is closer to zero or mildly negative.
A practical starting point: define extreme as funding that places the asset in roughly the top or bottom 20% of its recent historical distribution for the relevant window. For Hyperliquid perpetuals, this typically corresponds to:
| Condition | Approximate 1H Funding Rate |
|---|---|
| Neutral | −0.001% to +0.001% |
| Moderate long bias | +0.001% to +0.003% |
| Extreme long bias | Above +0.003% |
| Moderate short bias | −0.001% to −0.003% |
| Extreme short bias | Below −0.003% |
These thresholds are a starting point, not fixed rules. The funding panel on the dashboard displays funding across multiple windows (1H, 4H, 24H, 7D, 30D) — reviewing the trend in funding across windows gives a better read than any single snapshot. A market where 1H, 4H and 24H funding are all strongly positive is more extreme than one where only the 1H spike is elevated.
Using the Dashboard
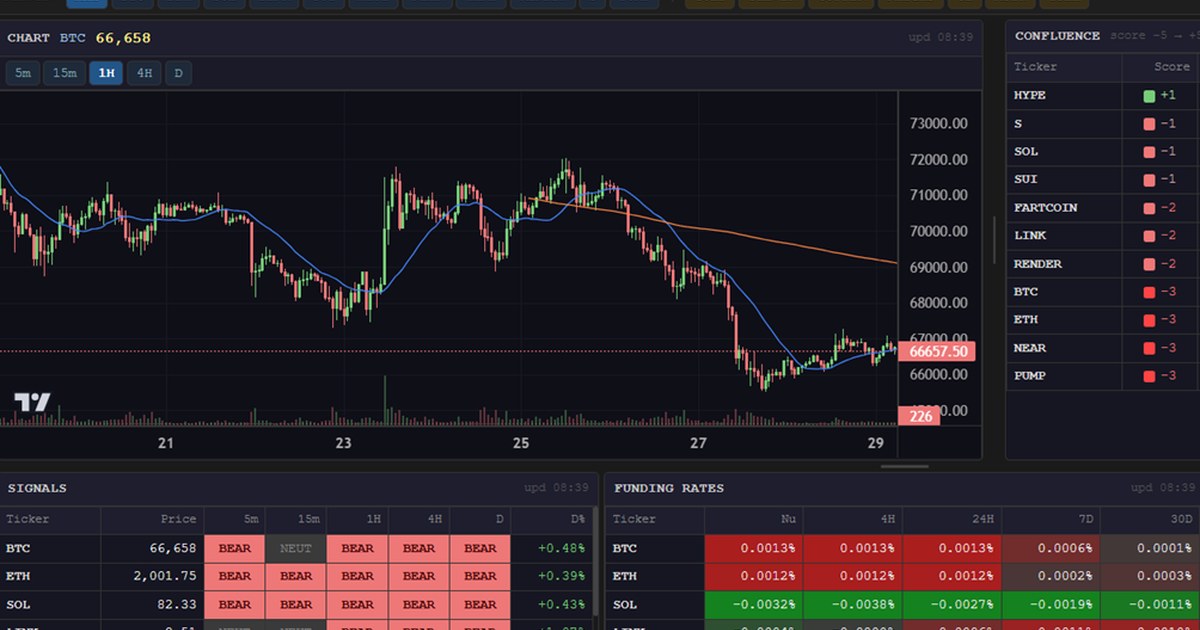
The TradFiDefi Live Dashboard is built around this two-layer framework. It displays:
- Signals panel — MA-based trend signals for 18 assets across 5min, 15min, 1H, 4H and D timeframes, with daily price change
- Funding panel — funding rates per asset across 1H, 4H, 24H, 7D and 30D windows, colour-coded from green (negative, short-biased) to red (positive, long-biased)
- Chart panel — candlestick chart with MA20 and MA200, accessible by clicking any signal cell directly from the table
The practical workflow:
- Open the signals panel and scan for assets with multi-timeframe bullish or bearish alignment
- Cross-reference the funding panel for those assets — identify whether funding is neutral, moderate or extreme
- Classify the setup using the four-scenario table above
- Click through to the chart to confirm the technical picture before acting
The dashboard updates every 30 seconds. Funding data is sourced directly from Hyperliquid.
Multi-Timeframe Alignment
The framework becomes more selective — and more powerful — when applied to multi-timeframe signal alignment. A single timeframe signal combined with funding data is useful. The same signal appearing across 1H, 4H and D simultaneously is materially stronger.
The highest-quality condition:
- Bullish (or bearish) on 1H, 4H and D simultaneously
- Funding neutral or opposing on the 4H and 24H windows
- Price clearly above (or below) both MAs on all three timeframes
When this condition appears, it represents a trend of multiple-timeframe conviction in a market where derivatives positioning has not yet caught up. These setups are rare — most assets are bullish on some timeframes and bearish on others — but when they appear they are worth treating as priority entries.
What the Framework Does Not Tell You
This is a filter, not a forecasting system. It does not predict price targets, determine exit levels, or account for macro drivers, on-chain supply conditions, or liquidity. A bullish signal with neutral funding does not guarantee a trade will work — it identifies a condition where the probabilistic setup is cleaner than alternatives.
It also does not account for event risk. Extreme funding ahead of a scheduled catalyst (macro data release, protocol unlock, major exchange outflow) may reflect rational positioning rather than speculative excess.
Use this framework as one layer in a broader process — alongside the on-chain indicators in On-Chain Cycle Indicators and the OI analysis in Reading Open Interest and Funding Rates.
Key Takeaways
- A trend signal tells you direction; funding tells you how crowded that direction already is — the combination produces higher-quality entries than either alone
- Match the funding window to the signal timeframe: 1H funding for short-term signals, 4H for intermediate, 24H for daily
- The highest-conviction setup is a confirmed trend signal with extreme funding in the opposite direction — the market is heavily positioned against the emerging trend
- The weakest setup is a trend signal with extreme funding in the same direction — you are entering a crowded trade late
- Neutral signal = no setup, regardless of funding conditions
- Multi-timeframe alignment with neutral or opposing funding is the most selective filter in the framework — rare but high-quality when it appears
- Use the TradFiDefi Live Dashboard to monitor both layers in real time across 18 assets