
Introduction
Derivatives markets in crypto are not a sideshow — they are often the primary venue for price discovery. On major exchanges like Binance, Bybit and Hyperliquid, the daily volume of perpetual futures contracts routinely exceeds spot volume by a factor of five to ten. Understanding what is happening in the derivatives market is not optional for any serious crypto analyst.
Two metrics give you the clearest window into derivatives market positioning: Open Interest and Funding Rates. Together they tell you how much leveraged capital is in the market, which side it is positioned on, and how much stress that positioning is under.
This article covers what each metric measures, how to read them individually, and how to use them together to identify overextended markets, potential squeeze setups, and conditions where the derivatives market is providing a tailwind or headwind for price.

Open Interest — How Much Leveraged Money Is in the Market
Open Interest (OI) is the total notional value of all open perpetual futures positions that have not been settled or closed. Every futures contract requires a buyer and a seller — OI counts both sides as one contract.
A rising OI means new money is entering the derivatives market and new positions are being opened. A falling OI means positions are being closed — either through profit-taking, stop-losses, or liquidations.
Why OI matters
OI is a measure of conviction and leverage in the system. A price move accompanied by rising OI is a fundamentally different signal than a price move accompanied by falling OI:
| Price | Open Interest | Interpretation |
|---|---|---|
| Rising | Rising | New longs entering — bullish, trend likely to continue |
| Rising | Falling | Shorts being squeezed or closed — bullish but may lack follow-through |
| Falling | Rising | New shorts entering — bearish, trend likely to continue |
| Falling | Falling | Longs being liquidated or closed — bearish but may be reaching exhaustion |
The most dangerous market condition is a rapid price rally accompanied by a sharp increase in OI — a crowded long that is vulnerable to a sudden reversal if sentiment shifts or a catalyst appears.
OI in absolute terms vs relative terms
Absolute OI figures ($10 billion, $20 billion) are less useful than OI relative to recent history and relative to market cap. An OI-to-market-cap ratio that is historically elevated indicates that a large proportion of the market’s value is sitting in leveraged derivatives positions — the fuel for a violent move in either direction.
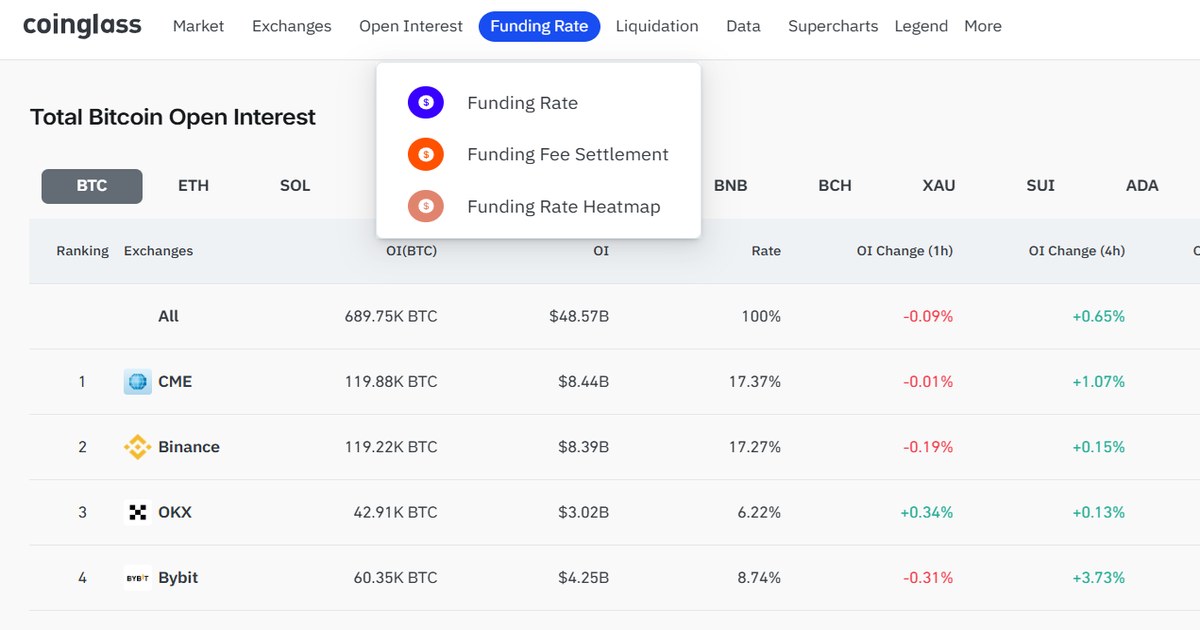
CoinGlass displays OI for individual assets across all major exchanges and provides historical charts that allow you to assess current OI relative to prior peaks and troughs.
Funding Rates — The Cost of Being Long
Perpetual futures have no expiry date, unlike traditional futures contracts. To keep the perpetual futures price anchored to the spot price, exchanges use a mechanism called the funding rate: periodic payments made between long and short position holders.
- When the perpetual futures price is above spot price, longs pay shorts (positive funding rate)
- When the perpetual futures price is below spot price, shorts pay longs (negative funding rate)
The size of the funding rate reflects how much the market is willing to pay to maintain its position. A high positive funding rate means longs are so eager to stay long that they are paying a significant premium to do so.
Reading funding rates
| Funding Rate | Market Condition | Implication |
|---|---|---|
| Strongly positive (e.g. above 0.05%/8h) | Heavily long-biased | Crowded long — vulnerable to sharp pullback or short squeeze unwind |
| Mildly positive (0.01–0.05%/8h) | Slight long bias | Normal bull market condition — no strong signal |
| Near zero (±0.01%/8h) | Balanced positioning | No strong directional bias from derivatives — neutral |
| Negative (below −0.01%/8h) | Short bias | Crowded short — potential for short squeeze if price rallies |
| Strongly negative (below −0.05%/8h) | Heavily short-biased | Extreme short crowding — historically precedes sharp relief rallies |
Funding rates are paid every 8 hours on most exchanges, though some pay hourly. The annualised equivalent of a 0.01%/8h rate is approximately 10.9% per year — a meaningful cost for holding a position in a sideways market.
Funding rates across time
The 8-hour funding snapshot tells you the current positioning. The 30-day average funding rate tells you the longer-term sentiment picture.
A market that has maintained persistently positive funding for weeks is accumulating an overhang of leveraged longs who are paying a carrying cost. At some point, either the price moves significantly higher (rewarding them) or they begin to exit (creating sell pressure). This dynamic is one of the most reliable setups for a market reset — a sharp pullback that flushes out over-leveraged longs, resets funding to neutral or negative, and creates a cleaner base for the next leg up.
Using OI and Funding Together
Neither metric in isolation gives you the complete picture. The combination is where the signal becomes actionable.
Setup 1 — Overextended Long (High Risk)
Conditions: OI at multi-month highs + funding strongly positive (above 0.05%/8h) + price has rallied significantly
What it means: the market is heavily leveraged long. A large proportion of participants are paying to stay long. Any negative catalyst — a macro data release, a large exchange outflow, a whale sell — can trigger a cascade of liquidations.
How to respond: reduce leverage, tighten stops, avoid adding new long exposure. This is not necessarily a signal to go short (the market can remain overbought longer than expected), but it is a signal to reduce risk.
Setup 2 — Short Squeeze Setup (Potential Opportunity)
Conditions: OI elevated + funding strongly negative + price has been falling for an extended period
What it means: the market is crowded short. Shorts are paying to stay short. If price reverses — even on modest positive news — shorts are forced to cover, adding buying pressure that accelerates the move upward.
How to respond: watch for price stabilisation or a catalyst that could trigger covering. A break above a clear resistance level with rising price and falling OI (shorts closing) is the confirmation signal.
Setup 3 — Healthy Trend (Continuation Likely)
Conditions: OI rising moderately + funding mildly positive + price making new highs with each OI increase
What it means: new money is entering on the long side with each price advance, but not at an extreme rate. The market is trending with conviction rather than being driven by over-leverage.
How to respond: maintain or add to long positions on pullbacks. The trend has underlying conviction.
Setup 4 — Exhaustion Bottom (Watch for Reversal)
Conditions: OI falling sharply + funding near zero or turning positive after an extended negative period + price stabilising
What it means: the short squeeze or capitulation is nearing completion. Leveraged shorts have been forced out. The market is returning to a more balanced state.
How to respond: begin watching for long entries on technical confirmation — a reclaim of a key level, a bullish SOPR cross, or a shift in exchange net flows.
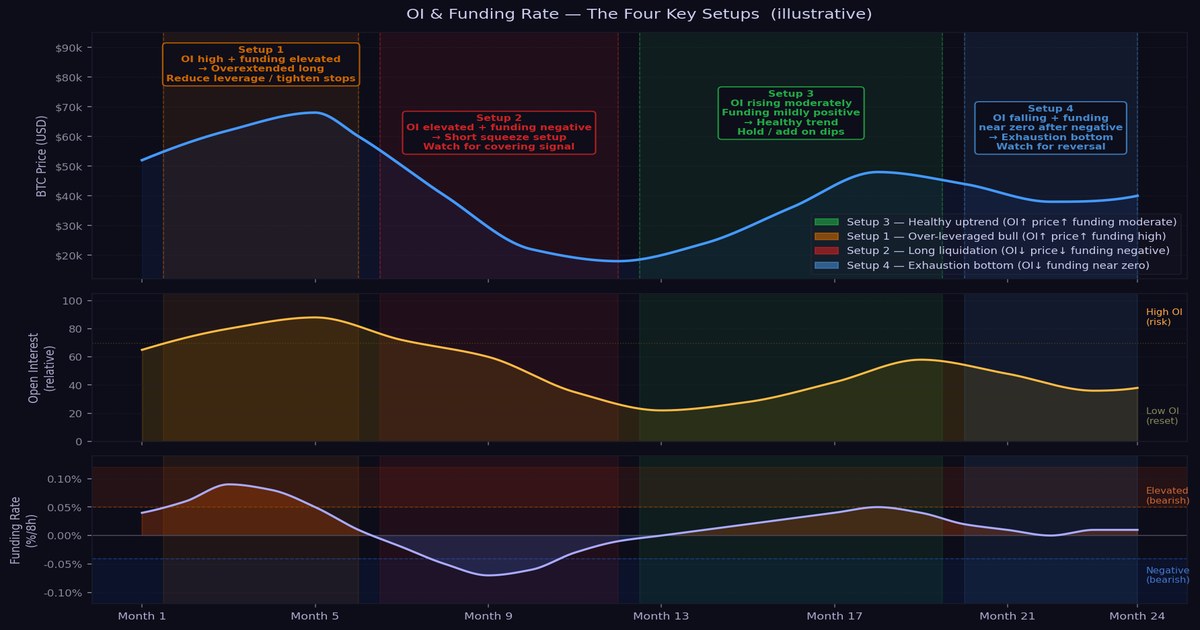
The four setups appear repeatedly across timeframes — learning to identify them is a core skill for reading derivatives markets. Click to zoom.

Practical Workflow — Weekly Derivatives Check
As with on-chain data, derivatives metrics should be reviewed on a structured cadence rather than checked compulsively. A brief weekly review is more useful than constant monitoring.
| Step | Metric | What to note |
|---|---|---|
| 1 | Total BTC Open Interest (CoinGlass) | At highs, lows, or mid-range relative to last 90 days? |
| 2 | BTC Funding Rate — current | Positive, negative, or near zero? |
| 3 | BTC Funding Rate — 30-day average | Persistent bias or neutral over time? |
| 4 | OI change vs price change this week | Which of the four setups best describes current conditions? |
| 5 | ETH and top alts funding | Are altcoins more or less extended than BTC? |
The output: a single label — overextended long, crowded short, healthy trend, or exhaustion — and a brief note on what would change that view.
Where to Access Funding and OI Data
| Platform | What it provides | Best for |
|---|---|---|
| CoinGlass | OI across all exchanges, funding rates, liquidation data, historical charts | Primary source — covers everything in this article |
| Coinalyze | OI, funding, volume — exchange-by-exchange breakdown | Identifying which exchanges are driving OI changes |
| Glassnode | OI, perpetuals premium, funding rates with on-chain context | Combining derivatives data with on-chain positioning |
| Exchange dashboards | Live funding rates and OI for that exchange’s markets | Monitoring the specific exchange you trade on |
CoinGlass is the essential starting point — it aggregates data across Binance, Bybit, OKX, CME, Hyperliquid and others into a single view. The next article in this section covers CoinGlass in more depth, including how to use its liquidation heatmap.
Key Takeaways
- Open Interest measures the total leveraged capital in the derivatives market — rising OI on a price move indicates new conviction; falling OI indicates position closing
- Funding rates reveal which side of the market is paying to hold its position — persistently positive rates indicate crowded longs, persistently negative rates indicate crowded shorts
- The most actionable setups combine both metrics: overextended longs (high OI + high positive funding) are vulnerable to sharp pullbacks; crowded shorts (high OI + negative funding) are vulnerable to squeeze rallies
- Use derivatives data on a weekly cadence — identify which of the four setups (overextended long, short squeeze setup, healthy trend, exhaustion bottom) best describes current conditions
- CoinGlass is the primary source for aggregated OI and funding data across all major exchanges
- Derivatives conditions explain price moves that on-chain data cannot — integrate both layers for a complete view