
Introduction
For decades, the financial industry has operated on a set of well-understood rules: regulated exchanges, established custodians, predictable trading hours, and institutional-grade risk frameworks. Crypto challenges many of those assumptions — but not always in the ways you might expect.
This is not a pitch. It is a structured comparison designed for professionals who think in Sharpe ratios, drawdowns and basis points. If you manage capital for a living, you deserve a factual look at what digital assets actually offer — and where the real risks lie.
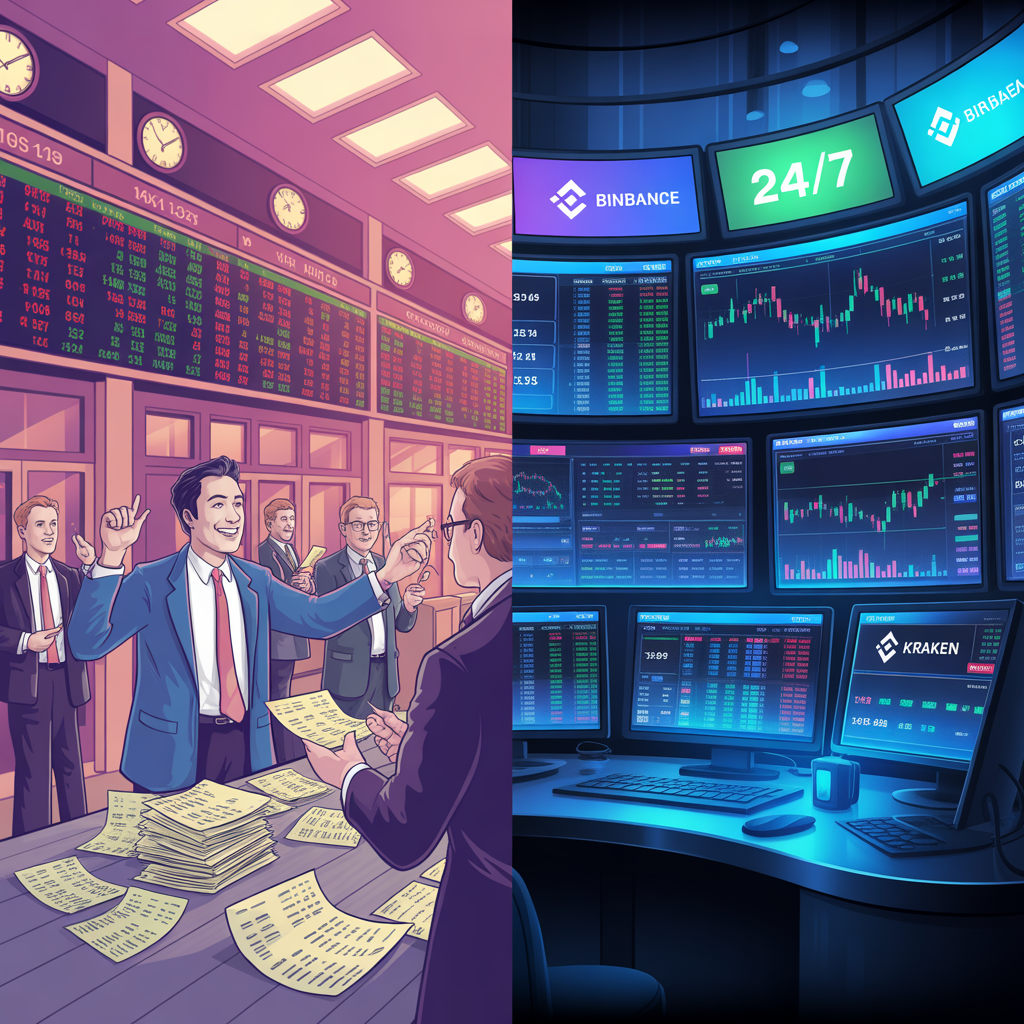
Markets That Never Close
One of the most immediate structural differences is market hours. Equity and bond markets close on weekends and public holidays. Crypto markets do not. Bitcoin traded through every financial crisis, every central bank meeting and every geopolitical event of the past decade — without a circuit breaker halting the action.
For a risk manager, this is both a feature and a challenge. Positions cannot be ”locked in” overnight. But for a portfolio manager seeking uncorrelated return streams, 24/7 liquidity opens possibilities that traditional markets simply cannot offer.
Volatility: The Real Numbers
Crypto’s reputation for volatility is well-earned — but context matters. Bitcoin’s annualised volatility has historically ranged between 50–80%. By comparison, the S&P 500 sits around 15–20% in calm periods, spiking to 40%+ during crises like March 2020.
However, the risk/return profile tells a more nuanced story. Over any five-year rolling window since 2015, Bitcoin has outperformed every major traditional asset class on a raw return basis — often with a Sharpe ratio that surprises TradFi professionals when they first run the numbers.
| Asset | Annualised Return | Annualised Volatility | Sharpe Ratio | Max Drawdown | Trading Hours |
|---|---|---|---|---|---|
| Bitcoin (BTC) | ~22% | ~65% | ~0.4 | −76% (2022) | 24/7/365 |
| Ethereum (ETH) | ~18% | ~80% | ~0.3 | −79% (2022) | 24/7/365 |
| S&P 500 | ~13% | ~17% | ~0.7 | −25% (2022) | Mon–Fri, 09:30–16:00 ET |
| US 10Y Treasury | ~−1% | ~9% | ~−0.2 | −25% (2022) | Mon–Fri (near-continuous) |
| Gold | ~9% | ~14% | ~0.5 | −20% (2022) | Sun–Fri (near-continuous) |
| MSCI World | ~11% | ~17% | ~0.6 | −21% (2022) | Mon–Fri (regional hours) |
Source: Bloomberg, CoinGecko, own calculations. All figures are indicative annualised estimates for 2021–2026. Past performance does not guarantee future results.
Liquidity: Deeper Than You Think
A common misconception is that crypto lacks institutional liquidity. The reality in 2026 is more nuanced. Bitcoin spot markets on regulated venues (Coinbase Prime, Fidelity Digital Assets, CME) routinely handle block sizes that would be unremarkable on an equity desk. Ethereum futures on CME have become a standard hedging tool.
Where liquidity thins out is in mid- and small-cap tokens — exactly the same dynamic you see in small-cap equities or high-yield credit. The lesson is not ”crypto is illiquid”. The lesson is that liquidity is concentrated, and professionals need to trade accordingly.
Correlation: The Portfolio Case
For years, one of crypto’s strongest arguments has been low correlation with traditional asset classes. That thesis was tested — and partially broken — during the 2022 rate-hike cycle, when Bitcoin briefly moved in line with risk assets. Since then, correlations have normalised to historically lower levels.
Critically, Bitcoin’s correlation with the S&P 500 over 2023–2026 has averaged around 0.2–0.35. For a portfolio manager building a diversified book, that is a meaningful diversifier — comparable to adding commodities or managed futures.
Custody and Counterparty Risk: The Honest Assessment
This is where TradFi professionals rightly push back. Traditional assets sit with regulated custodians under established legal frameworks. The collapse of FTX in 2022 was a stark reminder that counterparty risk in crypto is real — and historically underpriced.
The good news: the infrastructure has matured significantly. Institutional-grade custody now exists through regulated entities including Coinbase Custody Trust Company, Fidelity Digital Assets, Anchorage Digital (the first OCC-chartered digital asset bank) and Copper. Segregated custody, proof-of-reserves audits and regulated structures are no longer aspirational — they are available today.
Cost of Trading: A Genuine Advantage
One area where crypto compares favourably is transaction cost. Spot crypto trading fees on institutional venues run 2–5 basis points. On-chain settlement can occur in seconds at minimal cost, without the T+2 delay and clearing infrastructure of traditional markets. For high-frequency strategies and cross-border transactions, the cost advantage is material.
The 1–5% Allocation Question
A growing number of institutional allocators — sovereign wealth funds, family offices, pension funds — have moved from ”we are studying this” to ”we have a small allocation.” The typical initial position is 1–5% of AUM, sized to allow meaningful participation in upside while keeping total portfolio volatility impact contained.
The question for most TradFi professionals in 2026 is no longer whether crypto deserves consideration. It is how to size and structure an allocation that fits within existing risk frameworks.
Key Takeaways
- Crypto offers genuine diversification with historically low correlation to equities and bonds
- Volatility is real but the risk-adjusted return profile has been compelling over multi-year horizons
- Institutional-grade liquidity and custody infrastructure now exists for large allocators
- Counterparty and custody risk must be managed actively — the tools to do so are available
- Transaction costs and settlement speed are structural advantages over traditional markets
Next: Read our breakdown of the five most common myths about crypto that TradFi professionals still hold — and the data that challenges each one.