
Ready-to-use Pine Scripts built around the frameworks in the Tactics section. Each script runs on TradingView — paste into the Pine Editor, add to chart, done. New to Pine Script? Start with the Pine Script Guide first.
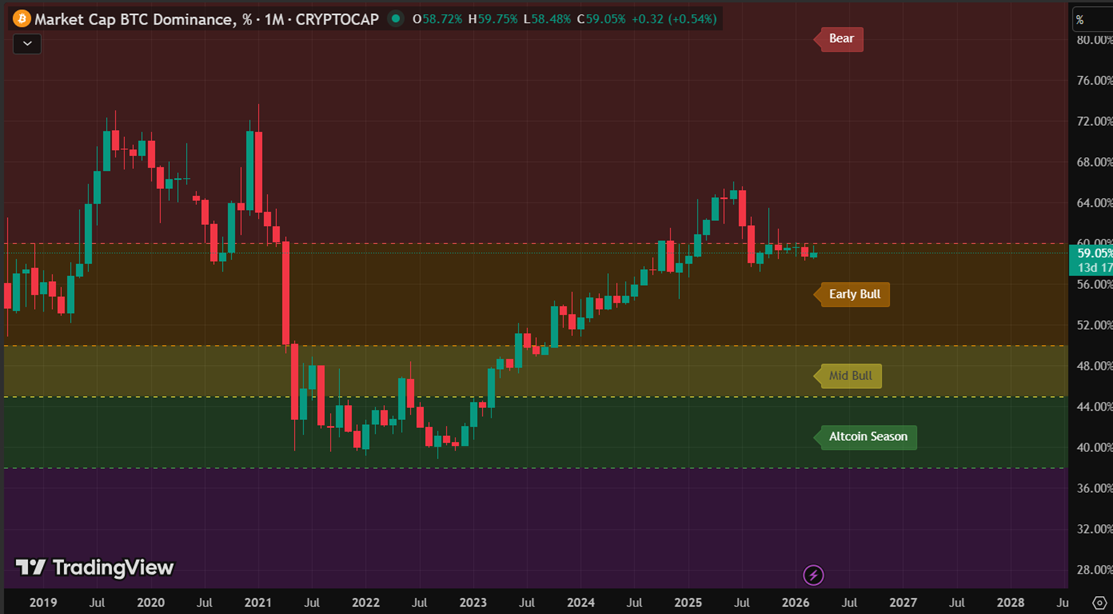
Colours the BTC Dominance chart background by market phase — Bear, Early Bull, Mid Bull, Altcoin Season and Extreme. Draws labelled zone boundaries and a phase label on the last bar. Read alongside the BTC Dominance article for full context on how to interpret each zone.
//@version=5
indicator("BTC Dominance Zones", overlay=true)

h100 = hline(100, "", color=color.new(color.red, 100))
h60 = hline(60, "60pct - Bear", color=color.red, linestyle=hline.style_dashed, linewidth=1)
h50 = hline(50, "50pct - Early Bull", color=color.orange, linestyle=hline.style_dashed, linewidth=1)
h45 = hline(45, "45pct - Mid Bull", color=color.yellow, linestyle=hline.style_dashed, linewidth=1)
h38 = hline(38, "38pct - Altcoin Season", color=color.green, linestyle=hline.style_dashed, linewidth=1)
h0 = hline(0, "", color=color.new(color.purple, 100))

fill(h100, h60, color=color.new(color.red, 80))
fill(h60, h50, color=color.new(color.orange, 80))
fill(h50, h45, color=color.new(color.yellow, 75))
fill(h45, h38, color=color.new(color.green, 75))
fill(h38, h0, color=color.new(color.purple, 75))

if barstate.islast
    label.new(bar_index, 80, "Bear", style=label.style_label_left, color=color.new(color.red, 60), textcolor=color.white, size=size.normal)
    label.new(bar_index, 55, "Early Bull", style=label.style_label_left, color=color.new(color.orange, 60), textcolor=color.white, size=size.normal)
    label.new(bar_index, 47, "Mid Bull", style=label.style_label_left, color=color.new(color.yellow, 60), textcolor=color.black, size=size.normal)
    label.new(bar_index, 41, "Altcoin Season", style=label.style_label_left, color=color.new(color.green, 60), textcolor=color.white, size=size.normal)
    label.new(bar_index, 19, "Extreme Altcoin / Top Risk", style=label.style_label_left, color=color.new(color.purple, 60), textcolor=color.white, size=size.normal)
Paste into a plain text editor first, then into TradingView Pine Editor. Add to chart on CRYPTOCAP:BTC.D.
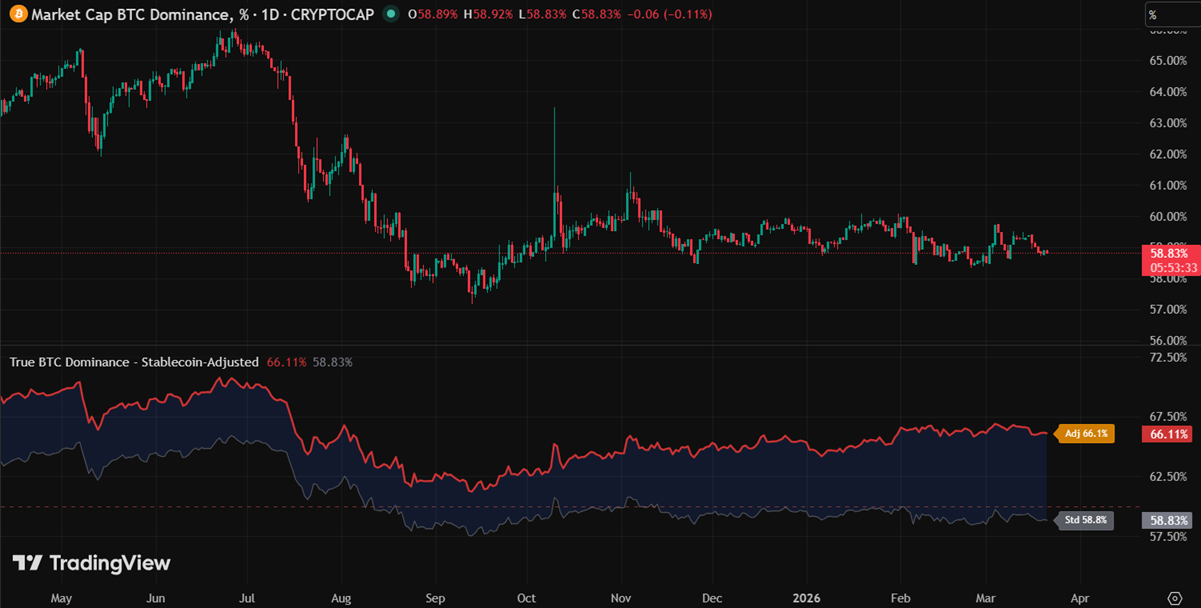
Standard BTC Dominance includes stablecoins in the total market cap — meaning BTC.D falls not only when capital rotates into alts, but also simply because USDT and USDC keep growing. This script corrects for that distortion by subtracting USDT and USDC market cap from the denominator.
The result: two lines plotted simultaneously — adjusted (orange, zone-coloured) and standard (grey) — with the gap between them filled in blue. When the gap widens, stablecoin dominance is rising: capital is parked defensively, not rotating into alts. Read alongside the BTC Dominance and Sector Rotation articles.
//@version=5
indicator("True BTC Dominance - Stablecoin-Adjusted", overlay=false, max_bars_back=500)

// Fetch market cap data
btc_mc   = request.security("CRYPTOCAP:BTC",   timeframe.period, close)
total_mc = request.security("CRYPTOCAP:TOTAL", timeframe.period, close)
usdt_mc  = request.security("CRYPTOCAP:USDT",  timeframe.period, close)
usdc_mc  = request.security("CRYPTOCAP:USDC",  timeframe.period, close)

// Adjusted dominance - total market cap minus USDT and USDC
adj_total = total_mc - usdt_mc - usdc_mc
adj_dom   = btc_mc / adj_total * 100

// Standard BTC.D for comparison
std_dom = request.security("CRYPTOCAP:BTC.D", timeframe.period, close)

// Zone colour for adjusted line (same thresholds as BTC Dominance Zones)
adj_col = adj_dom > 60 ? color.new(#cc3333, 0) :
          adj_dom > 50 ? color.new(#cc8833, 0) :
          adj_dom > 45 ? color.new(#aaaa33, 0) :
          adj_dom > 38 ? color.new(#33aa55, 0) :
                         color.new(#8833aa, 0)

// Plots
p_adj = plot(adj_dom, title="Adjusted BTC.D (excl. USDT+USDC)", color=adj_col, linewidth=2)
p_std = plot(std_dom, title="Standard BTC.D",                   color=color.new(color.gray, 40), linewidth=1)

// Fill between the two lines - gap represents stablecoin dominance
fill(p_adj, p_std, color=color.new(color.blue, 88), title="Stablecoin Gap")

// Zone reference lines
hline(60, "60% - Bear",           color=color.new(color.red,    50), linestyle=hline.style_dashed, linewidth=1)
hline(50, "50% - Early Bull",     color=color.new(color.orange, 50), linestyle=hline.style_dashed, linewidth=1)
hline(45, "45% - Mid Bull",       color=color.new(color.yellow, 50), linestyle=hline.style_dashed, linewidth=1)
hline(38, "38% - Altcoin Season", color=color.new(color.green,  50), linestyle=hline.style_dashed, linewidth=1)

// Current value labels on last bar
if barstate.islast
    label.new(bar_index + 2, adj_dom,
              "Adj " + str.tostring(math.round(adj_dom, 1)) + "%",
              style=label.style_label_left, color=color.new(color.orange, 20),
              textcolor=color.white, size=size.small)
    label.new(bar_index + 2, std_dom,
              "Std " + str.tostring(math.round(std_dom, 1)) + "%",
              style=label.style_label_left, color=color.new(color.gray, 30),
              textcolor=color.white, size=size.small)
Paste into a plain text editor first, then into TradingView Pine Editor. Add to chart on CRYPTOCAP:BTC.D.
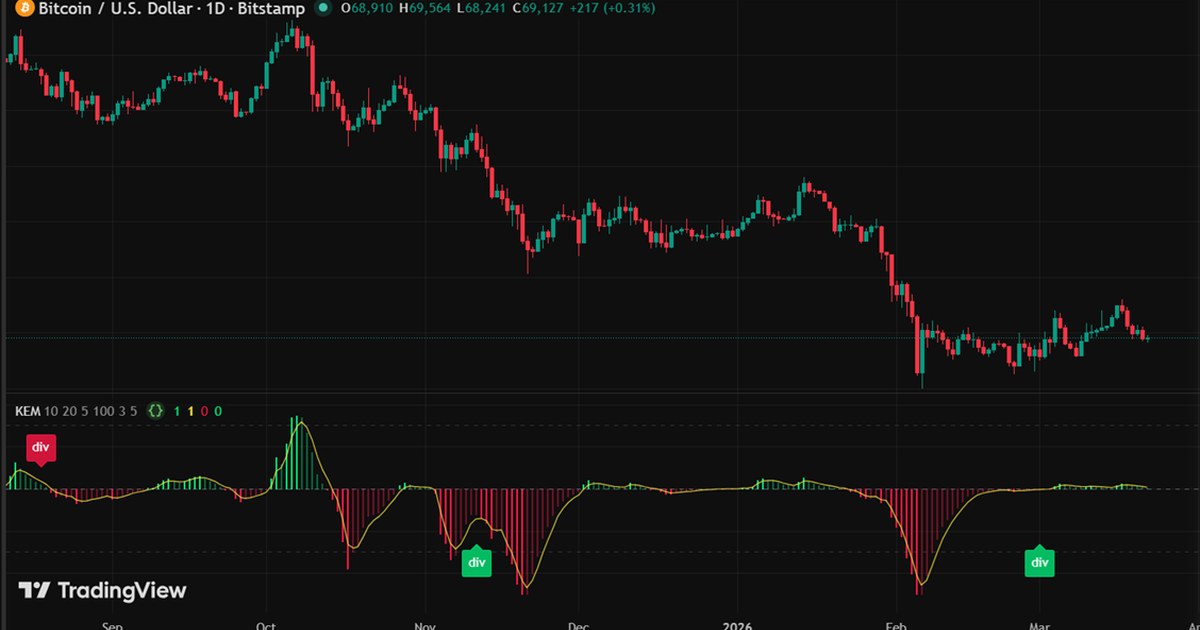
Most momentum indicators measure where price is — RSI, MACD, stochastics all tell you whether price is high or low relative to history. The Speedometer measures something different: how fast the move is going and whether that speed is increasing or collapsing. Think of it like a car’s rev counter — a bright bar means the engine is revving up, a faded bar means it’s running out of fuel. It combines rate-of-change (velocity) with relative volume, squaring the velocity so that conviction moves register strongly while low-volume noise stays small. The result is normalised to ±100 so it reads consistently across any instrument and timeframe. The key edge is divergence: when price makes a new high but the Speedometer does not, the move is already burning out before the chart shows it.
| Use case | Velocity | Vol SMA | Smoothing | Norm | Signal | Pivot |
|---|---|---|---|---|---|---|
| Scalping (5–15 min) | 5 | 20 | 2 | 50 | 2 | 3 |
| Intraday (1H–4H) | 10 | 20 | 5 | 100 | 3 | 5 |
| Swing trading (Daily+) | 14 | 20 | 7 | 200 | 3 | 8 |
Intraday settings are the defaults. Shorter velocity + lower normalisation = faster response but more noise. Longer pivot strength = fewer divergence signals but higher quality.
//@version=5
indicator("Speedometer - Kinetic Energy Momentum", shorttitle="KEM", overlay=false)

// ─── Inputs ───────────────────────────────────────────────────────────────────
vel_len    = input.int(10,  "Velocity length (bars)",  minval=2,  group="Calculation")
vol_len    = input.int(20,  "Volume SMA length",        minval=5,  group="Calculation")
smooth_len = input.int(5,   "EMA smoothing",            minval=1,  group="Calculation")
norm_len   = input.int(100, "Normalisation lookback",   minval=20, group="Calculation")
sig_len    = input.int(3,   "Signal line (EMA)",        minval=1,  group="Calculation")
pivot_len  = input.int(5,   "Pivot strength (bars)",    minval=2,  group="Divergence")

// ─── Velocity & relative volume ──────────────────────────────────────────────
// Velocity: rate of price change over N bars (%)
velocity  = ta.roc(close, vel_len)

// Relative volume: how active is this bar vs the rolling average?
rel_vol   = volume / ta.sma(volume, vol_len)

// ─── Kinetic Energy ───────────────────────────────────────────────────────────
// KE = rel_volume x velocity^2  — sign preserved for direction
// Squaring velocity amplifies large moves; volume acts as a noise filter.
// A fast move on low volume is weak signal. Fast move + high volume = real energy.
ke_raw    = rel_vol * velocity * math.abs(velocity)

// Light EMA smoothing to reduce bar-to-bar noise
ke_smooth = ta.ema(ke_raw, smooth_len)

// ─── Normalisation to +/-100 ─────────────────────────────────────────────────
// Scales against the max absolute reading in the lookback window
// so the indicator reads consistently across instruments and timeframes.
ke_max    = ta.highest(math.abs(ke_smooth), norm_len)
ke_norm   = ke_max != 0 ? (ke_smooth / ke_max) * 100 : 0.0

// ─── Signal line & acceleration state ────────────────────────────────────────
signal    = ta.ema(ke_norm, sig_len)

// Accelerating: bar is moving away from zero (energy building)
// Decelerating: bar is moving toward zero (energy fading)
accel_up  = ke_norm > ke_norm[1] and ke_norm > 0
accel_dn  = ke_norm < ke_norm[1] and ke_norm < 0

// ─── Colour logic ─────────────────────────────────────────────────────────────
// Bright colour = accelerating  |  Faded colour = decelerating
c_bull_strong = color.new(#00e676, 0)
c_bull_weak   = color.new(#00e676, 60)
c_bear_strong = color.new(#ff1744, 0)
c_bear_weak   = color.new(#ff1744, 60)

bar_col = ke_norm >= 0 ? (accel_up ? c_bull_strong : c_bull_weak) : (accel_dn ? c_bear_strong : c_bear_weak)

// ─── Plots ────────────────────────────────────────────────────────────────────
hline(  0, "Zero", color=color.new(color.gray, 30), linewidth=1)
hline( 60, "+60",  color=color.new(color.gray, 70), linestyle=hline.style_dashed)
hline(-60, "-60",  color=color.new(color.gray, 70), linestyle=hline.style_dashed)

plot(ke_norm, "KEM",    style=plot.style_histogram, color=bar_col, linewidth=2)
plot(signal,  "Signal", color=color.new(color.yellow, 20), linewidth=1)

// ─── Divergence detection via pivot swing points ──────────────────────────────
// Uses confirmed swing highs/lows — only fires when price and KEM disagree
// at real turning points, not on every new N-bar extreme.
//
// Bear divergence: price makes a higher swing high, KEM makes a lower swing high
// Bull divergence: price makes a lower swing low,  KEM makes a higher swing low
//
// Pivots are confirmed pivot_len bars after the swing point, so the label
// appears pivot_len bars to the right of the actual peak/trough.

ph = ta.pivothigh(close,   pivot_len, pivot_len)  // confirmed swing high in price
pl = ta.pivotlow(close,    pivot_len, pivot_len)  // confirmed swing low  in price
kh = ta.pivothigh(ke_norm, pivot_len, pivot_len)  // confirmed swing high in KEM
kl = ta.pivotlow(ke_norm,  pivot_len, pivot_len)  // confirmed swing low  in KEM

var float last_ph = na
var float last_kh = na
var float last_pl = na
var float last_kl = na

bear_div = false
bull_div = false

if not na(ph)
    if not na(last_ph) and ph > last_ph and not na(last_kh) and kh < last_kh
        bear_div := true   // higher price high, lower KEM high
    last_ph := ph

if not na(kh)
    last_kh := kh

if not na(pl)
    if not na(last_pl) and pl < last_pl and not na(last_kl) and kl > last_kl
        bull_div := true   // lower price low, higher KEM low
    last_pl := pl

if not na(kl)
    last_kl := kl

plotshape(bear_div, "Bearish divergence", style=shape.labeldown, location=location.top,    color=color.new(#ff1744, 20), text="div", textcolor=color.white, size=size.small)
plotshape(bull_div, "Bullish divergence", style=shape.labelup,   location=location.bottom, color=color.new(#00e676, 20), text="div", textcolor=color.white, size=size.small)
Paste into a plain text editor first, then into TradingView Pine Editor. Works on any chart and any timeframe.
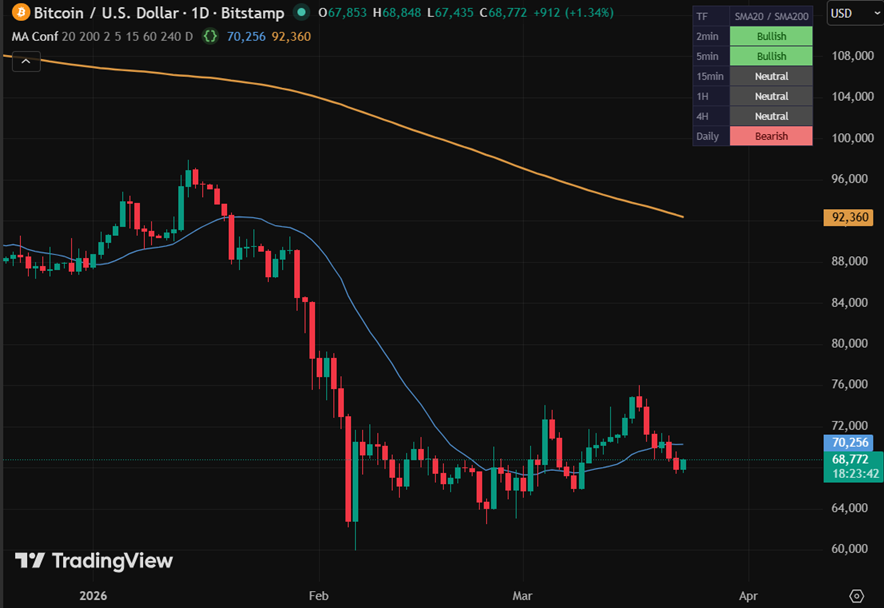
Most traders already use moving averages. The problem is that a bullish setup on the 1H chart means nothing if the daily is pointed the other way. This indicator solves that by showing the MA alignment across all your timeframes simultaneously — in a single compact table that sits quietly in the corner of your chart. The signal logic is deliberately simple: Bullish when price is above the fast MA and the fast MA is above the slow MA. Bearish when the opposite is true. Neutral everything else. No black box, no proprietary weighting — just the same MA logic applied across 6 timeframes at once. The sweet spot is when 3 or more timeframes agree. That is confluence.
//@version=5
indicator("MA Confluence - Multi-TF", shorttitle="MA Conf", overlay=true)

// ── INPUTS ─────────────────────────────────────────────────────────────────────
fast_len = input.int(20,  "Fast MA period", minval=1)
slow_len = input.int(200, "Slow MA period", minval=1)
use_ema  = input.bool(false, "Use EMA  (default: SMA)")
show_mas = input.bool(true,  "Show MA lines on chart (current TF)")

// Timeframe toggles + selectors (checkbox and TF picker on same line)
tf1_on = input.bool(true, "", inline="tf1", group="Timeframes")
tf1    = input.timeframe("2",   "2min",  inline="tf1", group="Timeframes")
tf2_on = input.bool(true, "", inline="tf2", group="Timeframes")
tf2    = input.timeframe("5",   "5min",  inline="tf2", group="Timeframes")
tf3_on = input.bool(true, "", inline="tf3", group="Timeframes")
tf3    = input.timeframe("15",  "15min", inline="tf3", group="Timeframes")
tf4_on = input.bool(true, "", inline="tf4", group="Timeframes")
tf4    = input.timeframe("60",  "1H",    inline="tf4", group="Timeframes")
tf5_on = input.bool(true, "", inline="tf5", group="Timeframes")
tf5    = input.timeframe("240", "4H",    inline="tf5", group="Timeframes")
tf6_on = input.bool(true, "", inline="tf6", group="Timeframes")
tf6    = input.timeframe("D",   "D",     inline="tf6", group="Timeframes")

// ── MA FUNCTIONS ───────────────────────────────────────────────────────────────
f_fast() => use_ema ? ta.ema(close, fast_len) : ta.sma(close, fast_len)
f_slow() => use_ema ? ta.ema(close, slow_len) : ta.sma(close, slow_len)

// ── DATA (request.security must be called unconditionally) ─────────────────────
[c1, ma1f, ma1s] = request.security(syminfo.tickerid, tf1, [close, f_fast(), f_slow()])
[c2, ma2f, ma2s] = request.security(syminfo.tickerid, tf2, [close, f_fast(), f_slow()])
[c3, ma3f, ma3s] = request.security(syminfo.tickerid, tf3, [close, f_fast(), f_slow()])
[c4, ma4f, ma4s] = request.security(syminfo.tickerid, tf4, [close, f_fast(), f_slow()])
[c5, ma5f, ma5s] = request.security(syminfo.tickerid, tf5, [close, f_fast(), f_slow()])
[c6, ma6f, ma6s] = request.security(syminfo.tickerid, tf6, [close, f_fast(), f_slow()])

// ── SIGNAL LOGIC ───────────────────────────────────────────────────────────────
// Bullish:  price > fast MA > slow MA
// Bearish:  price < fast MA < slow MA
// Neutral:  anything else
sig(c, f, s) => c > f and f > s ? 1 : c < f and f < s ? -1 : 0

s1 = sig(c1, ma1f, ma1s)
s2 = sig(c2, ma2f, ma2s)
s3 = sig(c3, ma3f, ma3s)
s4 = sig(c4, ma4f, ma4s)
s5 = sig(c5, ma5f, ma5s)
s6 = sig(c6, ma6f, ma6s)

// ── MA LINES (current chart TF only) ──────────────────────────────────────────
// Mid-tone blue and orange — visible on both dark and light chart themes
plot(show_mas ? f_fast() : na, "Fast MA", color=color.new(#5599dd, 0), linewidth=1)
plot(show_mas ? f_slow() : na, "Slow MA", color=color.new(#dd9944, 0), linewidth=2)

// ── COLOURS ────────────────────────────────────────────────────────────────────
c_bull_bg = #77cc77
c_bull_fg = #004400
c_bear_bg = #ee7777
c_bear_fg = #440000
c_neut_bg = #4a4a4a
c_neut_fg = #eeeeee
c_off_bg  = #2a2a2a
c_off_fg  = #444444
c_head_bg = #1a1a2e
c_head_fg = #888899

sig_bg(s)  => s ==  1 ? c_bull_bg : s == -1 ? c_bear_bg : c_neut_bg
sig_fg(s)  => s ==  1 ? c_bull_fg : s == -1 ? c_bear_fg : c_neut_fg
sig_txt(s) => s ==  1 ? "Bullish"  : s == -1 ? "Bearish"  : "Neutral"

// Human-readable TF labels
tf_label(tf) => tf == "1" ? "1min" : tf == "2" ? "2min" : tf == "3" ? "3min" : tf == "5" ? "5min" : tf == "10" ? "10min" : tf == "15" ? "15min" : tf == "30" ? "30min" : tf == "60" ? "1H" : tf == "120" ? "2H" : tf == "240" ? "4H" : tf == "D" ? "Daily" : tf == "W" ? "Weekly" : tf

// ── TABLE ──────────────────────────────────────────────────────────────────────
if barstate.islast
    var table tbl = table.new(position.top_right, 2, 7,
      bgcolor=color.new(#111118, 0),
      border_color=color.new(#2a2a40, 0), border_width=1,
      frame_color=color.new(#2a2a40, 0), frame_width=1)

    // Header row
    ma_type = use_ema ? "EMA" : "SMA"
    header  = ma_type + str.tostring(fast_len) + " / " + ma_type + str.tostring(slow_len)
    table.cell(tbl, 0, 0, "TF",   bgcolor=c_head_bg, text_color=c_head_fg, text_size=size.small, text_halign=text.align_left)
    table.cell(tbl, 1, 0, header, bgcolor=c_head_bg, text_color=c_head_fg, text_size=size.small)

    // Data rows
    tfs  = array.from(tf1,    tf2,    tf3,    tf4,    tf5,    tf6)
    sigs = array.from(s1,     s2,     s3,     s4,     s5,     s6)
    ons  = array.from(tf1_on, tf2_on, tf3_on, tf4_on, tf5_on, tf6_on)

    for i = 0 to 5
        on  = array.get(ons,  i)
        s   = array.get(sigs, i)
        tf  = array.get(tfs,  i)
        bg  = on ? sig_bg(s)  : c_off_bg
        fg  = on ? sig_fg(s)  : c_off_fg
        txt = on ? sig_txt(s) : "--"
        table.cell(tbl, 0, i + 1, tf_label(tf), bgcolor=c_head_bg, text_color=c_head_fg, text_size=size.small, text_halign=text.align_left)
        table.cell(tbl, 1, i + 1, txt,           bgcolor=bg,        text_color=fg,        text_size=size.small)
Paste into a plain text editor first, then into TradingView Pine Editor. Works on any chart and any timeframe.
More scripts added regularly. Each one is built to complement a Tactics article.