
Introduction
Pine Script is TradingView’s built-in scripting language. It lets you write custom indicators, strategy backtests and alert conditions that run directly on any chart — without setting up servers, APIs or external tools. If you can describe a trading rule in plain language, you can usually build it in Pine Script within minutes.
It is designed to be approachable for traders with no programming background, while remaining expressive enough for experienced developers to build sophisticated, multi-condition systems. Most traders who use TradingView daily never open the Pine Editor. The ones who do gain a significant edge: they stop relying on other people’s indicators and start building tools that match their exact methodology.
This guide covers what Pine Script can do, how it is structured, and how to get a working script on your chart in under five minutes.
What Pine Script Can Build
Pine Script covers four distinct use cases. Most traders start with indicators, but the real power comes from combining all four.
| Type | What It Does | Typical Use Case |
|---|---|---|
| Indicator | Plots data on a chart or in a separate pane | Custom moving averages, volume profiles, dominance zones, ratio charts |
| Strategy | Simulates entries and exits with a built-in backtester | Testing whether a rule-based system would have been profitable historically |
| Alert condition | Triggers TradingView alerts when a condition is met | Get notified when BTC.D crosses a key zone, when funding rate spikes, when price breaks a level |
| Library | Reusable functions shared across scripts | Advanced use — build once, import into multiple scripts |
For most traders, indicators and alert conditions are the two that matter. Strategies are useful for validation but come with important caveats around slippage, fees and look-ahead bias that make raw backtest numbers unreliable.
How Pine Script Works
Pine Script runs bar by bar, from the first historical candle to the current live candle. Every line of your script executes once per candle, in order. This means the language handles time series natively — you do not need to write loops to access previous candle data.
close        // current bar's closing price
close[1]     // previous bar's closing price
close[5]     // closing price 5 bars ago
This bar-by-bar model is the key concept that makes Pine Script different from general-purpose languages. Once you understand it, most of the syntax follows naturally.
Built-in variables
TradingView provides a full set of built-in variables for every bar:
| Variable | Value |
|---|---|
open, high, low, close |
OHLC prices for the current bar |
volume |
Volume for the current bar |
time |
Unix timestamp of the bar open |
bar_index |
Sequential bar number (0 = first bar) |
barstate.islast |
True only on the current live bar — useful for labels and alerts |
Anatomy of a Pine Script
Every script follows the same basic structure:
//@version=5
indicator("My Indicator", overlay=true)

// Your logic here
plot(close)
Line 1 — declares the Pine Script version. Always use version 5 (current stable).
Line 2 — declares what type of script this is (indicator, strategy or library) and sets the title. overlay=true means the script draws on the price chart. overlay=false means it opens in a separate pane below.
Lines 4+ — your logic. Calculate values, set conditions, plot results.
The three output functions you will use most
| Function | What It Does | Example |
|---|---|---|
plot() |
Draws a line on the chart | plot(close, color=color.white) |
bgcolor() |
Colours the chart background for each bar | bgcolor(close > open ? color.green : color.red, transp=85) |
hline() |
Draws a fixed horizontal line | hline(50, "Midpoint", color=color.gray) |
Getting a Script on Your Chart
Opening the Pine Editor and running a script takes less than two minutes.
Step 1 — Open the Pine Editor
At the bottom of any TradingView chart, click the Pine Editor tab. If you do not see it, click the three-dot menu at the bottom toolbar.
Step 2 — Clear the default code
The editor opens with a sample script. Select all (Ctrl+A) and delete it.
Step 3 — Paste your script
Copy a script from our library below. Important: paste it first into a plain text editor (Notepad, TextEdit) and then into TradingView. Copying directly from a web page sometimes introduces invisible characters that break the parser.
Step 4 — Add to chart
Click the Add to chart button at the top right of the Pine Editor. The script runs immediately on the current chart.
Step 5 — Set the correct symbol
Most scripts in this library are designed for specific charts (e.g. CRYPTOCAP:BTC.D for the dominance indicator). Make sure you are on the right symbol before running.
Common Mistakes to Avoid
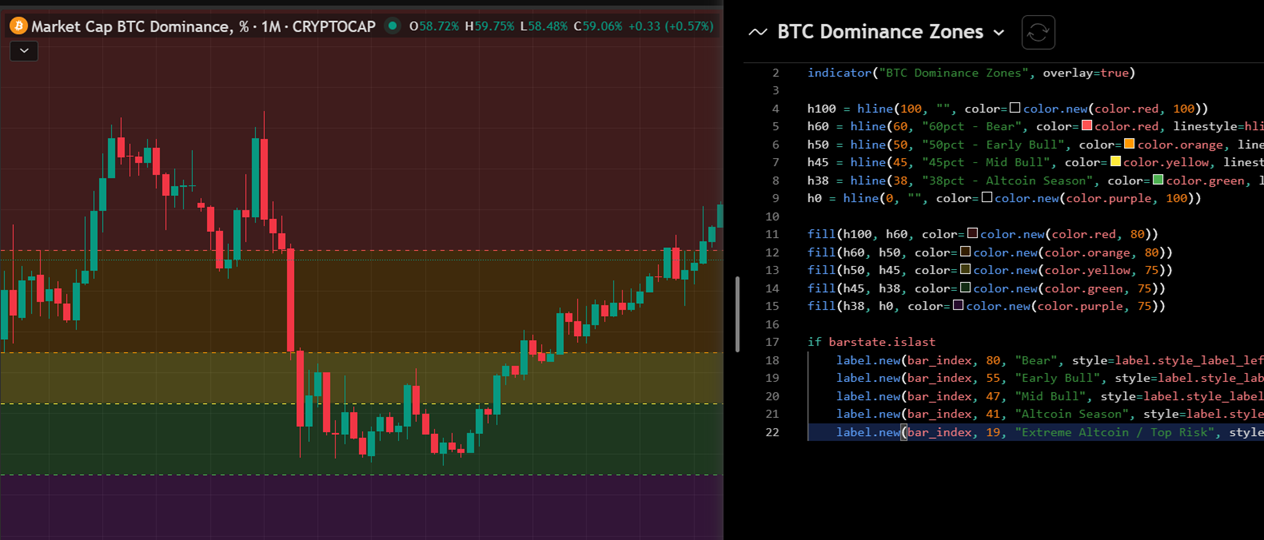
Using the wrong chart symbol. A dominance indicator needs to run on a dominance chart (BTC.D), not on a BTCUSDT price chart. The script reads close — if close is a price rather than a percentage, the zone thresholds will never trigger.
Copying directly from a browser. Web pages embed invisible unicode characters that Pine Script’s parser rejects with cryptic syntax errors. Always paste through a plain text editor first.
Expecting backtests to be realistic. Pine Script strategies run on historical data without accounting for spread, slippage or market impact. A strategy showing 80% win rate on a 1-minute chart is almost certainly curve-fitted. Use strategies for directional validation, not performance projection.
Treating indicators as signals. An indicator is a tool for organizing information, not a trade signal generator. The BTC Dominance zones script tells you what phase the market is likely in — it does not tell you when to buy or sell.
Next Steps
The fastest way to learn Pine Script is to take a working script, change one number, and see what happens. Iteration is the whole game.
Our script library covers the indicators we use as part of the Tactics framework — starting with the BTC Dominance zone indicator. Each script includes a plain-English explanation of what it does and how to interpret the output.