
Introduction
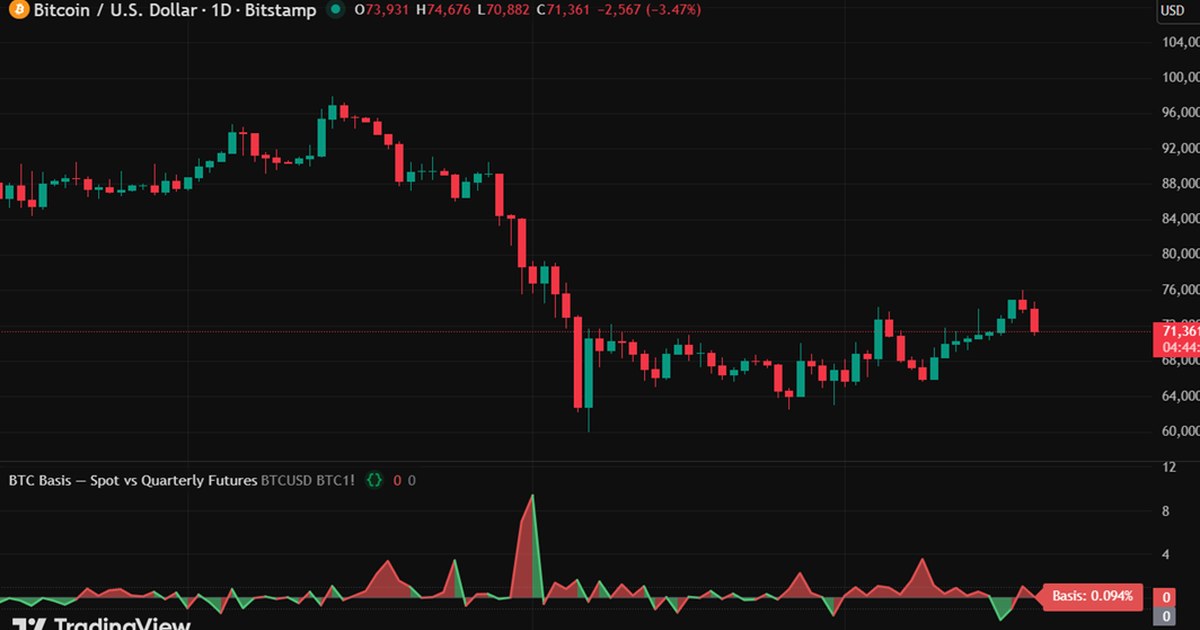
In traditional markets, the basis — the difference between a futures price and its underlying spot price — is a well-understood concept used by commodity traders, arbitrageurs and portfolio managers alike. In crypto, the same relationship exists and carries the same analytical value, but with a twist: perpetual futures add a funding mechanism that makes the signal richer and more continuous than in traditional quarterly futures markets.
The basis tells you what the derivatives market is pricing in relative to spot. When futures trade at a significant premium to spot, the market is paying extra to hold leveraged long exposure — a signal of bullish sentiment and speculative demand. When futures trade at a discount, the market is paying to hold short exposure — a signal of bearish sentiment or hedging demand.
This article covers how to read the basis across both perpetual and quarterly futures, what the different basis regimes mean for market positioning, and how to use basis signals alongside funding rates and OI for a complete derivatives picture.
Two Types of Futures, Two Basis Signals
Crypto futures markets have two distinct instruments, each producing a slightly different basis signal.
Perpetual Futures
Perpetual futures have no expiry date. They track spot price through the funding rate mechanism — longs pay shorts when the perpetual trades above spot, shorts pay longs when it trades below. The funding rate is the market’s mechanism for keeping the perpetual price anchored.
The perpetuals basis is therefore expressed primarily through the funding rate itself: a high positive funding rate means perpetuals are trading at a sustained premium to spot, reflecting strong long demand. This is why funding rate analysis (covered in the previous article) is effectively basis analysis for perpetual markets.
Quarterly Futures
Quarterly futures expire on a fixed date — typically the last Friday of each quarter. Unlike perpetuals, they have no funding mechanism, so their price can deviate from spot freely based on market expectations about where spot will be at expiry.
The quarterly basis (also called the annualised basis or cash-and-carry rate) is expressed as:
Annualised Basis (%) = ((Futures Price − Spot Price) / Spot Price) × (365 / Days to Expiry) × 100
This converts the raw price difference into an annualised yield, making it comparable across different contracts and time periods. A quarterly basis of 10% annualised means the market is pricing in approximately 10% annualised upside from the current spot price to futures expiry.
Reading the Quarterly Basis
The quarterly basis is one of the cleanest sentiment indicators in crypto because it is set by sophisticated traders making deliberate allocation decisions — not by retail traders reacting to price moves.
| Annualised Basis | Market Condition | Interpretation |
|---|---|---|
| Above 20% | Extreme contango | Highly speculative — strong bullish demand for leveraged exposure; historically near cycle peaks |
| 10–20% | Elevated contango | Bullish sentiment, active speculation — typical of sustained uptrends |
| 5–10% | Moderate contango | Healthy bull market — reasonable premium for leverage, no excess |
| 0–5% | Low contango | Cautious or transitional market — low bullish conviction |
| Below 0% (backwardation) | Futures below spot | Bearish or heavy hedging demand — market pricing in downside, or institutions selling forward |
Contango and backwardation
When futures trade above spot, the market is in contango — the normal condition in a risk-on environment where participants are willing to pay a premium for leveraged long exposure.
When futures trade below spot, the market is in backwardation — an unusual condition that signals either strong bearish conviction, heavy institutional hedging (selling futures to lock in prices), or a supply shock. In crypto, sustained backwardation has historically been associated with late-stage bear markets or sharp panic selloffs.
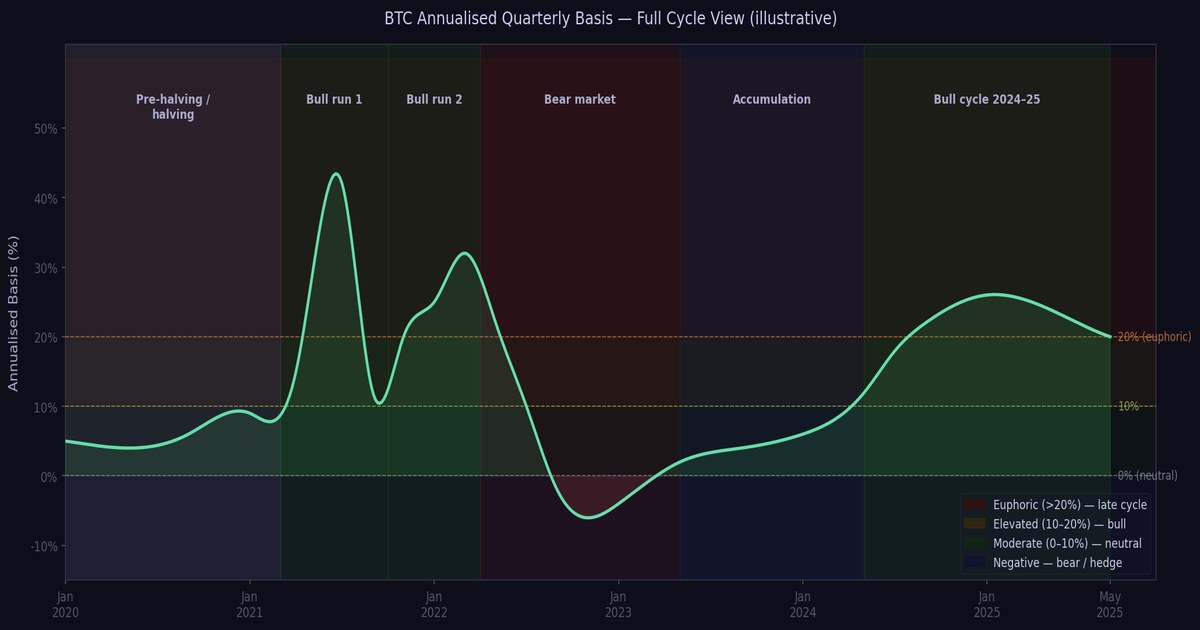
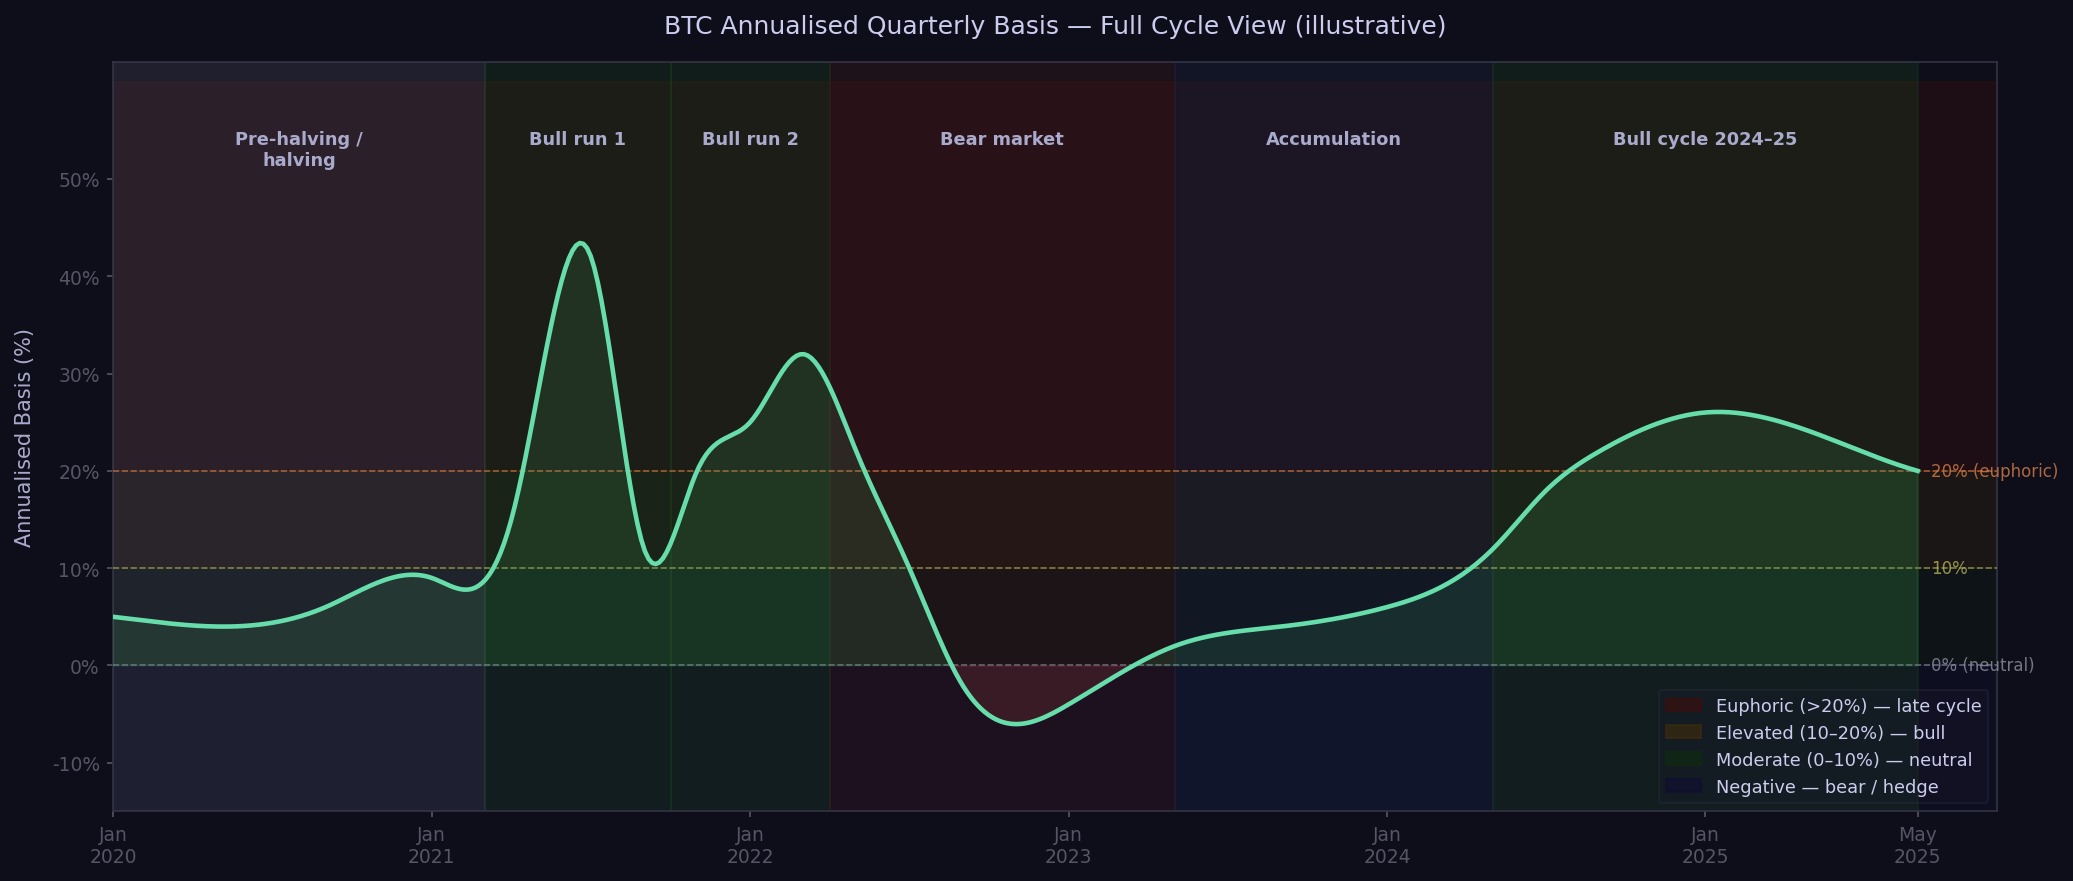
The Basis as a Cycle Indicator
Like funding rates, the quarterly basis compresses and expands across the market cycle in a consistent pattern.
Early bull market: basis rises from near zero as new speculative demand enters the market. Futures begin to price in optimism. Basis moves from 5% to 10–15% annualised over several months.
Mid-cycle: basis stabilises in the 10–20% range. This is the most sustained phase — the market is bullish but not yet euphoric. Basis fluctuates with each price surge and correction but remains firmly positive.
Late cycle (euphoria): basis spikes above 20%, sometimes reaching 30–50% annualised during peak speculative episodes. Futures traders are willing to pay enormous premiums for leveraged long exposure. This is the zone where risk/reward for new long positions deteriorates sharply.
Bear market transition: basis collapses — often faster than price falls. When the basis drops from 20%+ to near zero within weeks, it signals a rapid exit of speculative capital from the derivatives market. This is frequently an early warning signal that precedes further spot price weakness.
Bear market: basis remains near zero or negative. Quarterly futures may trade at a discount to spot as hedgers dominate. This is the accumulation zone — the market has priced out speculative excess.
Cash-and-Carry Arbitrage — Why the Basis Has a Floor
The quarterly basis does not rise without limit. There is a structural mechanism that caps it: cash-and-carry arbitrage.
When the quarterly basis becomes large enough to be attractive relative to risk-free rates, professional traders and institutions execute a market-neutral trade:
- Buy spot Bitcoin
- Simultaneously sell the equivalent amount in quarterly futures at the premium price
- At expiry, deliver the spot Bitcoin against the futures contract and capture the basis as yield
This trade — holding spot and shorting futures — is delta-neutral (no directional price risk) and earns the basis as a yield. When enough capital executes this trade, the selling pressure in futures compresses the basis back toward a more sustainable level.
Why this matters for analysis
The cash-and-carry trade creates a natural feedback mechanism: when basis is very high, arb traders compress it; when basis is very low, the arb is unattractive and capital exits, allowing the basis to remain suppressed.
For the analyst, this means: – A basis that stays elevated despite significant arb capital trying to compress it signals exceptionally strong speculative demand — a late-cycle warning – When the basis falls below the risk-free rate (currently roughly 4–5% in USD), the carry trade is unprofitable and institutions have no incentive to hold the trade — a neutral or bearish signal for derivatives sentiment
Combining Basis with Funding and OI
The three derivatives metrics — basis, funding rate, and OI — work best as a combined system. Each captures a slightly different aspect of the same underlying question: how much speculative capital is in the market, on which side, and at what cost?
| Metric | What it captures | Timescale |
|---|---|---|
| Perpetuals funding rate | Real-time cost of holding leveraged long or short exposure | 8-hour snapshots, daily/weekly trends |
| Quarterly basis (annualised) | Longer-horizon sentiment — what the market expects over weeks to months | Weekly to monthly trends |
| Open Interest | Total leveraged capital in the market — the size of the bet | Daily changes, weekly trend |
Strongest bullish derivatives signal: high positive funding + elevated quarterly basis (15%+) + rising OI. All three confirm strong speculative demand and bullish conviction — but also elevated vulnerability to a reset.
Strongest bearish derivatives signal: negative funding + near-zero or negative quarterly basis + falling OI. All three confirm speculative exit and bearish conditions — but also potentially approaching exhaustion of selling pressure.
Divergence signals: when one metric breaks from the others, it is worth investigating. If OI is rising but the quarterly basis is falling, it may indicate new short positions are being opened rather than new longs — a bearish setup disguised as rising activity.
Practical Application
For macro positioning: check the annualised quarterly basis monthly. A sustained reading above 15% is a signal to begin reducing leverage and moving toward a more defensive allocation. A reading near zero or negative is a signal that speculative excess has cleared — accumulation conditions are historically favourable.
For trade timing: watch the funding rate on a weekly basis alongside spot price. When price rallies sharply and funding spikes above 0.05%/8h simultaneously, the move is likely crowded — wait for a funding reset before adding to long positions.
For identifying institutional activity: the quarterly basis is where institutional capital leaves its clearest footprint. A rising quarterly basis without a corresponding rise in perpetuals funding can indicate institutional long positioning via futures rather than retail leverage via perpetuals — a structurally stronger signal.
Where to Access Basis Data
| Platform | What it provides |
|---|---|
| CoinGlass | Annualised basis for quarterly futures across Binance, Bybit, OKX, CME — historical charts and current readings |
| Glassnode | Futures premium index, basis rate with on-chain context overlay |
| Laevitas | Detailed basis analysis across exchanges and maturities — professional-grade derivatives data |
| CME Group | CME Bitcoin futures basis — the most institutionally relevant basis signal, as CME is the primary venue for regulated institutional futures trading |
The CME basis deserves special attention: because CME is accessible to regulated institutions (pension funds, asset managers, hedge funds) that cannot trade on offshore exchanges, the CME basis reflects a different segment of market participants than Binance or Bybit. A widening CME basis while offshore exchange basis remains flat suggests institutional demand is leading retail sentiment — historically a positive signal.
Key Takeaways
- The basis — the difference between futures and spot prices — is a direct measure of sentiment in the derivatives market: positive basis reflects bullish speculative demand, negative basis (backwardation) reflects bearish conditions or institutional hedging
- The annualised quarterly basis is the cleanest cycle sentiment indicator in derivatives markets — above 15% is historically elevated, above 20% signals late-cycle excess, near zero or negative signals bear market conditions
- Cash-and-carry arbitrage creates a natural cap on the basis — when the basis exceeds the arb threshold, professional capital compresses it; when it falls below, the suppression can be sustained
- Combine basis with funding rates and OI for a complete derivatives picture — alignment across all three is the strongest signal; divergence between them is worth investigating
- The CME basis is the most institutionally relevant basis signal — watch it as a leading indicator of regulated capital flow into Bitcoin
- Rising basis on a price rally confirms new speculative demand; falling basis on a price rally is a warning that derivatives sentiment is not confirming the move