
Introduction
Understanding on-chain indicators in theory is one thing. Building a repeatable workflow with them is another. Most analysts who try Glassnode for the first time are overwhelmed by the breadth of available metrics — over 900 indicators across addresses, entities, derivatives, mining, supply and more. Without a framework, it is easy to spend an hour looking at charts and come away with no actionable conclusion.
This article is a practical guide to using Glassnode effectively. It covers which metrics matter most at each stage of the market cycle, how to structure a weekly on-chain review, and how to combine Glassnode data with price action to produce a coherent view rather than a collection of disconnected signals.
The goal is not to memorise every indicator. It is to build a small, reliable set of metrics that you understand well enough to act on.
Free vs Paid — What You Actually Need
Glassnode has three access tiers: Free, Analyst and Advanced. For most independent analysts, the Analyst tier ($29/month) provides everything needed for cycle analysis. The Advanced tier unlocks entity-adjusted metrics and shorter-timeframe data — useful for professional research but not essential for macro positioning.
| Metric | Free | Analyst | Advanced |
|---|---|---|---|
| MVRV Z-Score | ✓ (delayed) | ✓ real-time | ✓ |
| SOPR / aSOPR | ✓ (delayed) | ✓ real-time | ✓ |
| Puell Multiple | ✓ (delayed) | ✓ real-time | ✓ |
| Exchange Net Position Change | ✗ | ✓ | ✓ |
| Long/Short-Term Holder Supply | ✗ | ✓ | ✓ |
| Entity-Adjusted Metrics | ✗ | ✗ | ✓ |
| Sub-daily resolution | ✗ | Weekly/Monthly | ✓ |
For macro cycle positioning — which is what this article focuses on — the Analyst tier is sufficient. If budget is a constraint, Look Into Bitcoin offers the key cycle indicators (MVRV Z-Score, Puell Multiple, Pi Cycle Top) for free with no delay.
The Core Dashboard — Six Metrics
Rather than browsing 900 metrics, build a dashboard of six. These six cover the three things you actually need to know: where are we in the cycle, who is holding, and is smart money buying or selling.
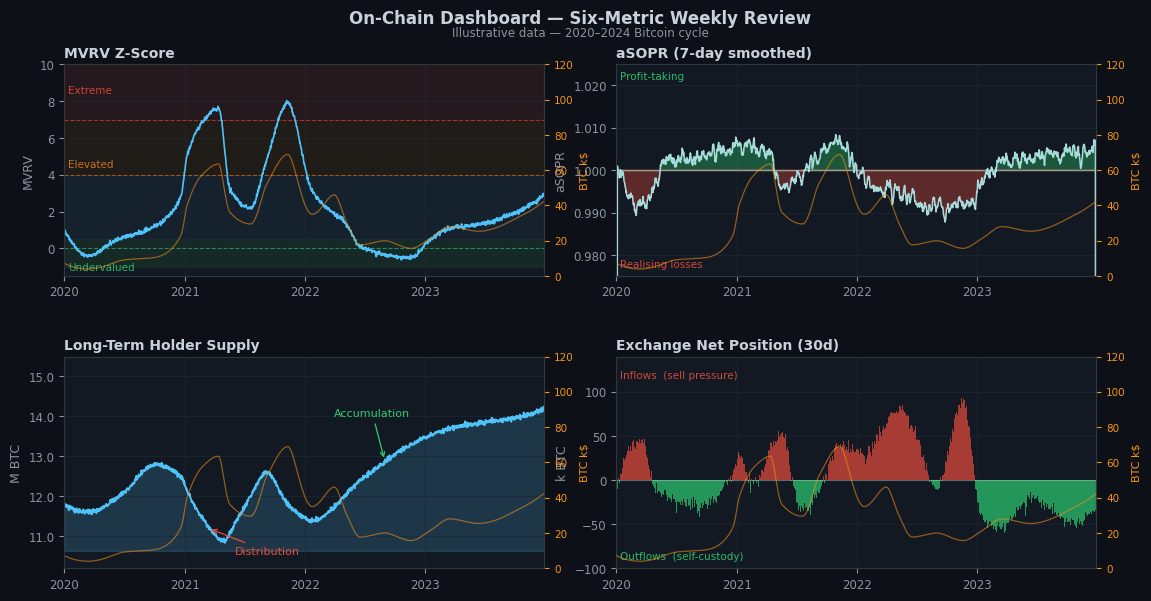
1. MVRV Z-Score — Macro Position
The primary cycle positioning metric. Load it at weekly resolution and overlay the Bitcoin price. Your job is simple: note what zone you are in (see the MVRV ranges in the On-Chain Cycle Indicators article) and whether the score is rising or falling.
A rising MVRV in the 2–5 zone is a healthy bull market. A rising MVRV above 5 is an elevated bull market where risk management should become more active. A falling MVRV that breaks below 1 is the accumulation phase.
2. aSOPR — Trend Confirmation
Check aSOPR at daily resolution, smoothed over a 7-day period. You are watching one thing: is the 1.0 level acting as support or resistance?
In a bull market, every dip toward 1.0 that bounces is a confirmation. In a bear market, every rally toward 1.0 that rejects is a confirmation. The regime shift — a sustained hold above 1.0 after an extended period below — is one of the most reliable macro signals in the on-chain toolkit.
3. Long-Term Holder (LTH) vs Short-Term Holder (STH) Supply
Glassnode segments the Bitcoin supply by the age of the last transaction. Coins that have not moved for 155 days or more are classified as Long-Term Holder supply. Coins that moved within the last 155 days are Short-Term Holder supply.
The ratio between these two groups tells you a great deal about cycle dynamics:
| Observation | Interpretation |
|---|---|
| LTH supply increasing — STH supply falling | Accumulation — experienced holders absorbing supply from sellers |
| LTH supply decreasing — STH supply rising | Distribution — long-term holders selling into strength, new buyers absorbing |
| LTH supply at all-time high | Peak conviction — historically precedes major bull runs as supply is locked away |
| LTH supply falling sharply | Late cycle distribution — long-term holders exiting, often near tops |
This metric is the best proxy for ”smart money” behaviour in the Bitcoin ecosystem — long-term holders have, historically, bought near bottoms and sold near tops.
4. Exchange Net Position Change — Supply Pressure
This metric shows how much Bitcoin is flowing onto or off exchanges on a net basis. It is a direct measure of short-term sell pressure.
- Coins flowing onto exchanges (positive net position change): holders are preparing to sell — a bearish signal, particularly if happening at elevated MVRV levels
- Coins flowing off exchanges (negative net position change): holders are moving coins to self-custody — a bullish signal, suggesting reduced near-term sell pressure
Look at the 30-day rolling net position to smooth out daily noise. Sustained outflows during a price consolidation have historically preceded significant moves upward.
5. Puell Multiple — Miner Cycle
Load the Puell Multiple alongside Bitcoin price at weekly resolution. You are watching for two setups:
- Puell below 0.5 with price showing early signs of stabilisation → historically a favourable entry zone
- Puell above 4 with price in a sustained uptrend → historically near cycle tops, miner distribution underway
The Puell Multiple moves slowly — check it monthly rather than daily.
6. Realised Price — Cost Basis Floor
The Realised Price is the average price at which all Bitcoin in existence last transacted. It is the aggregate cost basis of all holders. When Bitcoin’s spot price falls below the Realised Price, the average holder is underwater — a condition that has historically coincided with cycle bottoms or the final capitulation phase.
Think of the Realised Price as a gravity line: price tends to spend very little time below it.
A Practical Weekly Review Process
The mistake most analysts make with Glassnode is checking it too often. On-chain data is macro data — it changes slowly and meaningfully. Daily checking produces noise. Weekly checking produces signal.
Here is a structured 15-minute weekly review:
| Step | Metric | What to note |
|---|---|---|
| 1 | MVRV Z-Score | Current zone + direction (rising or falling) |
| 2 | aSOPR (7-day smooth) | Above or below 1.0? Bouncing or rejecting? |
| 3 | LTH Supply change (vs 4 weeks ago) | Accumulating or distributing? |
| 4 | Exchange Net Position (30-day) | Net inflows or outflows? |
| 5 | Puell Multiple | In extreme zone (below 0.5 or above 4)? |
| 6 | Spot price vs Realised Price | Above or below? By how much? |
After running through these six, write a single sentence summarising your on-chain view: bullish, neutral, or cautious, and why. Over weeks, this builds a log that reveals how your views evolved relative to price — invaluable for improving your process.
Combining On-Chain Data with Price Action
On-chain data operates on a different timescale from price action. Price can move 20% in a week; on-chain metrics rarely shift meaningfully in that time. This means the two should never be used for the same decisions.
On-chain data answers: where are we in the macro cycle? What is the risk level? Is smart money accumulating or distributing?
Price action answers: when should I enter or exit a specific trade? What is the current trend? Where are the key support and resistance levels?
A practical framework:
- Use on-chain data to set your stance — whether you are in accumulation mode, position-building mode, or distribution mode
- Use price action (moving averages, market structure, volume) to determine timing within that stance
- Never use a single on-chain signal to justify a trade against the price trend — if MVRV says accumulate but price is in freefall, accumulate in stages, not all at once
The On-Chain Cycle Indicators article explains each underlying metric in detail. This article is about how to use them operationally.
Common Mistakes
Watching too many metrics. If you track 30 indicators, they will always give you conflicting signals and you will never have a clean view. Constrain yourself to six and know them well.
Treating lagging metrics as timing signals. MVRV and Puell Multiple are cycle positioning tools — they tell you the risk environment, not when to click buy or sell. Using them for trade timing will produce frustrating results.
Ignoring context. An MVRV Z-Score of 3.0 means something different in a rising market than in a falling one. Always note the direction of the metric, not just its level.
Over-indexing on one signal. When LTH supply is increasing but exchange inflows are also rising, you have a mixed signal. The correct response is to size accordingly — not to pick the signal that supports your existing position.
Forgetting the halving distortion. As noted in the previous article, Bitcoin halvings distort the Puell Multiple and some supply metrics in the 3–6 months post-halving. Flag this context when reading those metrics.
Where Glassnode Fits in the Broader Toolkit
Glassnode covers Bitcoin and Ethereum on-chain data with the greatest depth. For other crypto assets, on-chain data quality drops off significantly — most altcoins lack the analyst coverage and data infrastructure that Bitcoin has built up over 15 years.
| Information Need | Best Source |
|---|---|
| Bitcoin cycle positioning | Glassnode — MVRV, SOPR, LTH/STH supply |
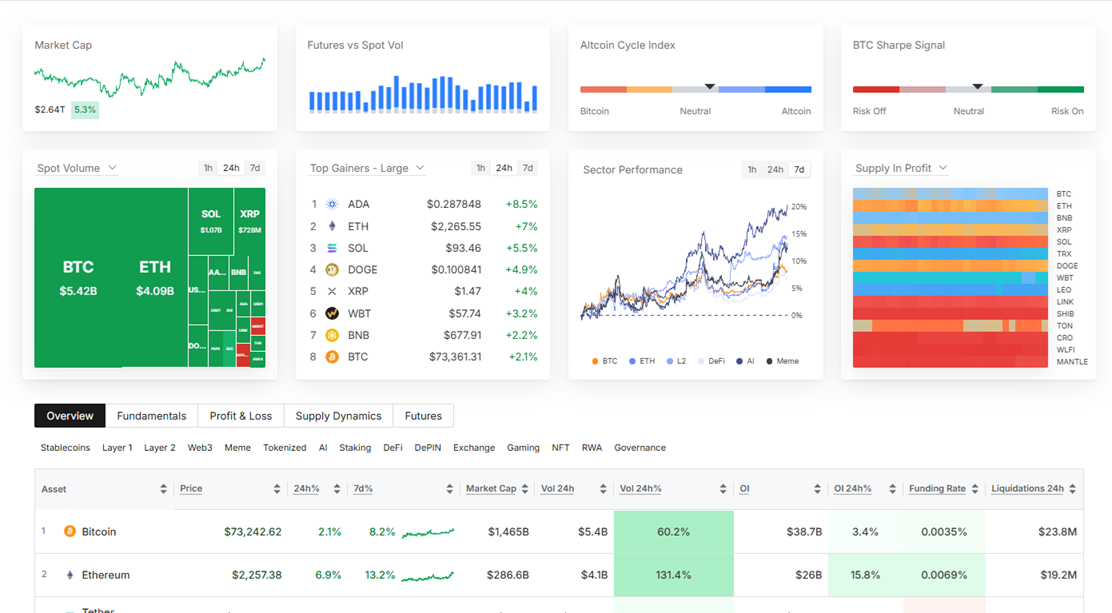
| Derivatives sentiment | CoinGlass — open interest, funding rates, liquidation maps |
| Market-wide valuation | CoinGecko — market cap, dominance, volume |
| DeFi ecosystem health | DeFiLlama — TVL, protocol flows |
| Price action and technicals | TradingView — charting, moving averages, volume |
On-chain data is not a replacement for the other layers of analysis — it is one input in a multi-source framework. Its distinctive value is that it measures actual behaviour (what holders did) rather than sentiment (what holders said or felt).
Key Takeaways
- Build a focused dashboard of six metrics: MVRV Z-Score, aSOPR, LTH/STH supply, exchange net position, Puell Multiple, and Realised Price
- Run a 15-minute weekly review and write one sentence summarising your on-chain view — consistency beats completeness
- Use on-chain data to set your macro stance; use price action for timing within that stance
- LTH supply trends are the best proxy for smart money behaviour — accumulation during downtrends and distribution during uptrends has been consistent across every Bitcoin cycle
- Glassnode’s Analyst tier covers all the cycle-relevant metrics — the free tier with Look Into Bitcoin is a viable alternative if budget is a constraint
- On-chain data is Bitcoin and Ethereum-centric — for altcoin decisions, weight other data sources more heavily