
Introduction
Most traders analyse individual assets. The professionals who consistently outperform across full market cycles do something different: they analyse the market itself first, and individual assets second.
In crypto, four macro-level charts — Total Market Cap, BTC Dominance, Total2 and Total3 — form a framework that tells you which phase of the market cycle you are in, where capital is flowing, and which category of asset is most likely to outperform in the weeks and months ahead.
This page explains how to read each chart, how they interact, and how to use them together as a positioning tool — not a prediction tool.
The Four Charts and What They Measure
Before going deeper, it helps to be precise about what each chart actually represents.
| Chart | What it measures | Where to find it |
|---|---|---|
| Total | Market cap of all cryptocurrencies combined | TradingView: TOTAL |
| BTC Dominance | Bitcoin’s share of total crypto market cap (%) | TradingView: BTC.D |
| Total2 | Total market cap excluding Bitcoin | TradingView: TOTAL2 |
| Total3 | Total market cap excluding Bitcoin and Ethereum | TradingView: TOTAL3 |
The relationship between these four charts — specifically how they diverge and converge — is where the analytical signal lies.
Total Market Cap — The Macro Pulse
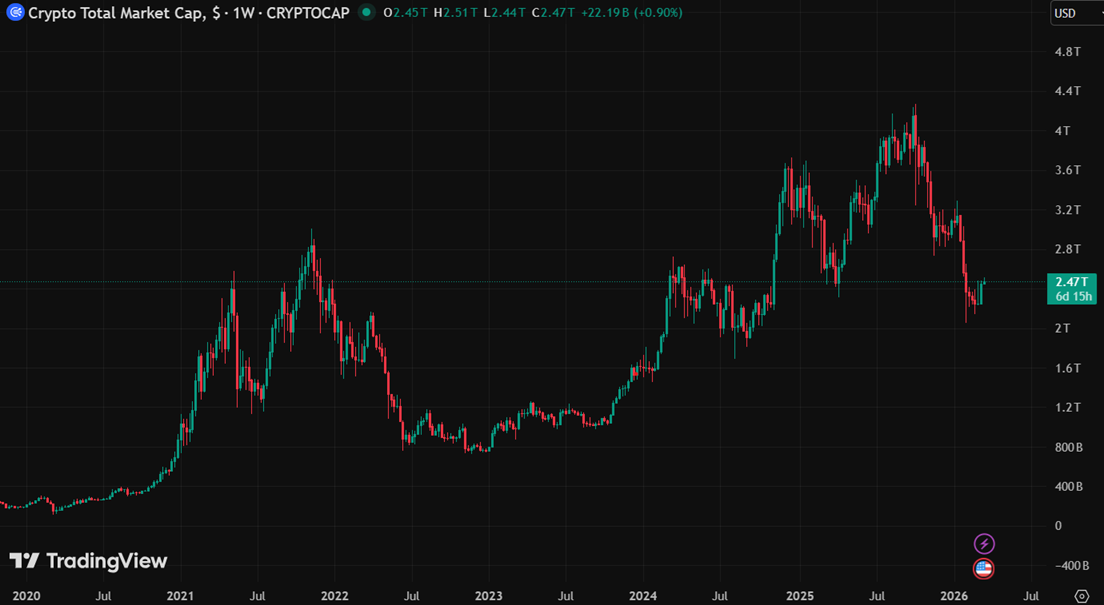
TOTAL is the starting point. It tells you whether the overall crypto market is expanding or contracting. Like looking at global equity market cap rather than a single stock index — it smooths out the noise of individual asset volatility.
What to look for on TOTAL
Trend direction is the primary signal. A rising TOTAL in an uptrend is the broadest possible confirmation that the market is in a risk-on phase. A falling TOTAL in a downtrend — particularly one breaking through prior support levels — is a warning to reduce exposure regardless of individual asset conviction.
Key levels on TOTAL behave like support and resistance on individual charts, but with more significance because they represent the aggregate behaviour of all market participants simultaneously. The $1 trillion, $2 trillion and $3 trillion levels have all acted as significant structural levels in recent cycles.
Rate of change matters as much as direction. A slow, grinding TOTAL rally is a different market to a vertical TOTAL expansion. The latter typically signals late-cycle conditions — high retail participation, high leverage, high risk of a sharp reversal.
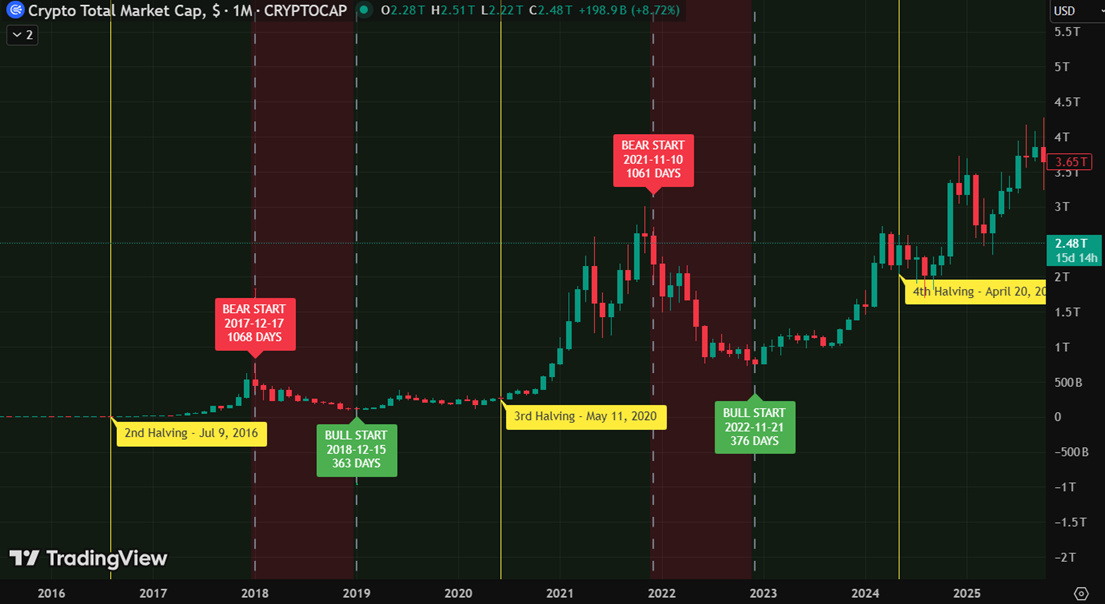
TOTAL and the halving cycle
Bitcoin’s halving — the programmed halving of new BTC issuance that occurs approximately every four years — has historically acted as the ignition point for the bull market phase of the cycle. The timing relationship is not mechanical, but the pattern is consistent: halving → accumulation phase → bull run → blow-off top → multi-year bear → next halving.
| Halving Date | Approximate Bull Market Peak | TOTAL at Peak | Drawdown to Cycle Bottom |
|---|---|---|---|
| November 2012 | December 2013 | ~$15B | ~85% |
| July 2016 | December 2017 | ~$600B | ~85% |
| May 2020 | November 2021 | ~$3T | ~75% |
| April 2024 | TBD | TBD | TBD |
The consistent pattern of 75–85% peak-to-trough drawdowns is one of the most important data points for risk management in crypto. It means that even a perfectly timed entry at the start of a bull run can result in holding through a 75%+ drawdown if you miss the exit.
BTC Dominance — The Capital Flow Signal
BTC Dominance (BTC.D) is not just a measure of Bitcoin’s relative size. It is a real-time indicator of where market participants are allocating risk within the crypto ecosystem.
The dominance cycle
The pattern repeats across cycles with remarkable consistency:
Phase 1 — Bear market / accumulation: BTC dominance rises. In risk-off conditions, capital consolidates into Bitcoin — the most liquid, most institutionally familiar, lowest-risk asset in the space. Retail leaves the market entirely. Dominance often reaches 50–60%+ at cycle bottoms.
Phase 2 — Early bull market: BTC leads the rally. Dominance holds steady or continues rising as Bitcoin outperforms. This is the phase where institutional allocators are most comfortable — buying BTC is a legible decision they can defend.
Phase 3 — Mid bull market: Dominance peaks and begins declining. Capital rotates into Ethereum and large-cap altcoins (Total2 starts outperforming Total). This is the first rotation signal.
Phase 4 — Late bull market: Dominance falls sharply. Capital flows aggressively into small-cap and speculative altcoins (Total3 starts outperforming Total2). Memecoins and newly listed tokens generate the largest percentage returns. This is the highest-risk, highest-reward phase.
Phase 5 — Top and reversal: Dominance bottoms and begins rising again, often rapidly. This is frequently one of the first signals that the bull market is ending — capital begins consolidating back into BTC as risk appetite fades.
| BTC Dominance Reading | Typical Market Phase | Implication for Positioning |
|---|---|---|
| 55–65%+ | Bear market / early accumulation | BTC outperforms; altcoin exposure high risk |
| 50–55%, falling | Early bull — BTC leading | BTC core position, selective large-cap alts |
| 45–50%, falling | Mid bull — ETH/large caps rotating | Increase ETH and Total2 exposure |
| 38–45%, falling | Late bull — altcoin season | High-beta alts, Total3 exposure |
| Any level, rising sharply | Market stress / top signal | Reduce altcoin exposure, consolidate to BTC |
What distorts BTC Dominance
Dominance readings can be temporarily distorted by large new token launches (which add to total market cap and dilute dominance), by Ethereum price surges that compress BTC’s relative share, and by periods of extreme stablecoin inflows or outflows. Always read dominance alongside TOTAL and price action, not in isolation.
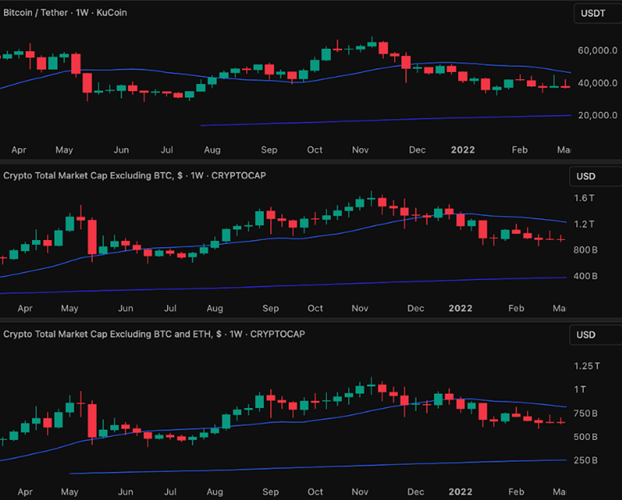
Total2 — The Ethereum and Altcoin Barometer
Total2 (total market cap excluding Bitcoin) tells you whether the broader market is outperforming or underperforming Bitcoin. When Total2 is rising faster than TOTAL, capital is rotating out of Bitcoin into the rest of the market. When Total2 is falling faster than TOTAL, the opposite is happening.
The Total2/TOTAL ratio
The most useful derived signal from Total2 is its ratio to TOTAL. When this ratio is rising, altcoins are collectively outperforming BTC. When it is falling, BTC is outperforming. This is mathematically equivalent to BTC dominance falling or rising — but looking at it as a ratio often makes the trend clearer on a chart.
What Total2 tells you that BTC Dominance does not
BTC Dominance compresses Ethereum and all other altcoins into a single number. Total2 separates that signal: you can see whether the rotation is happening in large-cap (Ethereum-driven) or is genuinely broad-based. In early altcoin season, Total2 rises primarily because Ethereum is rising. In late altcoin season, Total2 rises even when Ethereum is flat — because the long tail of smaller coins is driving the gain.
Total3 — The Speculative Pulse
Total3 (total market cap excluding Bitcoin and Ethereum) is the most speculative of the four charts. It captures the market cap of everything that is not BTC or ETH — hundreds of altcoins, memecoins, layer-2 tokens, DeFi protocols and newly listed assets.
When Total3 is rising sharply relative to both Total2 and BTC, you are in the late-cycle speculative phase. This is the phase where the largest percentage gains are concentrated — and where the largest percentage losses follow.
In practice, comparing BTC separately against Total2 and Total3 is often clearer than using TOTAL as the reference. BTC is the anchor — when it starts losing ground to both Total2 and Total3, rotation is unambiguous. TOTAL blends BTC into the index and can obscure the signal.
The danger of Total3 analysis
Total3 is the easiest chart to misread. Because it aggregates hundreds of assets, it can appear to be in a healthy uptrend even when the majority of assets within it are declining — a small number of outperforming tokens can hold the index up. Always cross-reference Total3 with BTC Dominance and with the performance of the specific assets you are considering.
Putting It Together — A Practical Framework
The four charts are most powerful when read as a system. Here is how a systematic analyst might use them together:
Step 1 — Determine the macro trend. Is TOTAL in an uptrend or downtrend on the weekly chart? This sets the directional bias. In a downtrend, the default position is defensive. In an uptrend, the framework helps you decide how aggressively to allocate and to which assets.
Step 2 — Identify the cycle phase. Where is BTC Dominance and is it rising or falling? This tells you which category of asset is likely to outperform. Falling dominance from high levels = early rotation signal. Dominance below 45% and still falling = late-cycle speculative phase.
Step 3 — Confirm with Total2 and Total3. Is Total2 outperforming TOTAL? Is Total3 outperforming Total2? Each successive confirmation increases confidence that you are reading the rotation correctly.
Step 4 — Watch for reversals. The most important signals are reversals, not trends. BTC Dominance beginning to rise after a sustained decline is a more actionable signal than dominance that has been falling for months. TOTAL breaking below a key support level after an extended rally is more significant than TOTAL that is already in a downtrend.
| Signal Combination | Reading | Positioning Implication |
|---|---|---|
| TOTAL up, Dominance rising | Early bull — BTC-led | Overweight BTC, underweight alts |
| TOTAL up, Dominance flat/falling, Total2 outperforming | Mid bull — ETH rotation | Add ETH and large-cap alts |
| TOTAL up, Dominance falling fast, Total3 outperforming | Late bull — altcoin season | High-beta alts, tight stops |
| TOTAL flat/down, Dominance rising fast | Risk-off / potential top | Reduce altcoins, consolidate to BTC/stables |
| TOTAL down, Dominance rising, Total3 collapsing | Bear market | Stablecoins or BTC only |
What This Framework Does Not Tell You
This framework is a macro positioning tool — it tells you where in the cycle you are likely to be and which broad category of asset is likely to outperform. It does not tell you:
- Which specific altcoins to buy. Total3 rising does not mean every altcoin rises. In late-cycle conditions, a small number of tokens account for a disproportionate share of the gains.
- The timing of reversals. The framework identifies phases, not turning points. Dominance can fall further than you expect, and TOTAL can stay in a downtrend longer than is comfortable.
- Whether this cycle will repeat the pattern. As the crypto market matures and institutional participation grows, the clean four-year cycle structure may compress or change character. The framework is evidence-based, not deterministic.
Used correctly, it is one of the most valuable tools for avoiding the most common mistake in crypto markets: buying the wrong type of asset at the wrong phase of the cycle.
Key Takeaways
- TOTAL gives you the macro trend — the single most important input for directional bias
- BTC Dominance tells you where in the rotation cycle you are — BTC-led, ETH-led or altcoin-led
- Falling dominance from high levels is an early rotation signal; dominance beginning to rise after a sustained decline is a risk-off warning
- Total2 confirms whether rotation is real; Total3 tells you whether speculative capital is flowing into the long tail
- The framework identifies cycle phases, not entry and exit points — combine it with on-chain indicators and price action for timing