
Introduction
No indicator reliably identifies the exact top or bottom of a crypto market cycle. Anyone claiming otherwise is selling something. What experienced analysts can do is identify the confluence of conditions that have historically preceded major reversals — and use that information to reduce risk near tops and increase conviction near bottoms.
This article covers the indicators and behavioural signals that have the strongest historical track record across multiple Bitcoin cycles. Some are on-chain, some are sentiment-based, some are derivatives-driven. None work in isolation. Used together, they form a weight-of-evidence framework that shifts probabilities — not certainties.
The goal is not to sell the exact top or buy the exact bottom. It is to avoid the most common and costly mistake in crypto: holding maximum risk at maximum price.
Why Tops and Bottoms Are Hard to Call
Before covering the indicators, it is worth understanding why this is genuinely difficult — and why the difficulty is structural, not just a matter of needing better data.
Markets top on good news. The peak of a bull market typically coincides with the best fundamental backdrop: positive regulatory developments, rising institutional adoption, record on-chain activity, mainstream media coverage. Everything looks good at the top. The indicators that signal danger are subtle and require active interpretation.
Markets bottom on bad news. The best buying opportunities arrive when sentiment is at its worst — exchange collapses, regulatory crackdowns, prolonged price depression. Buying at cycle bottoms requires acting against the dominant narrative at the time.
Every cycle is different enough to create doubt. The 2017 cycle peaked at $20k. The 2021 cycle peaked at $69k. The patterns repeat, but the specific price levels, timing and catalysts differ enough that there is always a plausible argument that ”this time it’s different.” That argument is usually wrong at extremes, but it is never obviously wrong in the moment.
Top Signals — What to Watch Near Cycle Peaks
1. MVRV Z-Score — The Most Reliable On-Chain Top Indicator
Market Value to Realised Value (MVRV) compares Bitcoin’s current market cap to its ”realised cap” — the aggregate value of every BTC at the price it last moved on-chain. The Z-Score normalises this ratio against its historical standard deviation.
Reading: When MVRV Z-Score enters the red zone (historically above 6–7), the market is significantly overvalued relative to the cost basis of all holders. Every major Bitcoin cycle top has occurred while MVRV was in the red zone.
| Cycle Top | Approximate MVRV Z-Score at Peak | BTC Price at Peak |
|---|---|---|
| December 2013 | ~10 | ~$1,150 |
| December 2017 | ~9.5 | ~$20,000 |
| November 2021 | ~7.5 | ~$69,000 |
The declining peak Z-Score across cycles suggests the market is maturing — each successive cycle produces less extreme overvaluation. This is useful context: waiting for a Z-Score of 9+ in future cycles may mean missing the top entirely.
Where to find it: Glassnode, Look Into Bitcoin.
2. Funding Rates — The Leverage Thermometer
When perpetual futures funding rates are persistently elevated — above 0.05–0.1% per 8-hour period across multiple exchanges simultaneously — the market is carrying significant long leverage. This leverage needs to be unwound, and the unwinding is rarely orderly.
Extreme positive funding does not cause tops, but it makes the market fragile. A relatively small catalyst can trigger a cascade of liquidations that accelerates into a major correction.
The signal: multiple consecutive days of funding rates above 0.05% per 8 hours, combined with open interest at or near all-time highs, is a condition that has historically preceded sharp corrections of 20–40% even within bull markets — and has coincided with cycle tops when combined with other indicators.
3. Retail Arrival — The Google Trends and App Store Signal
One of the most consistent signals preceding cycle tops is the arrival of retail participants who have no prior crypto experience. This is measurable:
- Google Trends for ”buy bitcoin”, ”how to buy crypto”, ”what is ethereum” spike to multi-year highs
- Crypto exchange apps appear in the top 10 of App Store and Google Play download charts
- Mainstream financial media runs front-page crypto coverage with price predictions
- People with no investment background ask about buying crypto at social gatherings
This is not a precise timing indicator, but its presence in combination with on-chain overvaluation signals significantly increases the probability that a top is forming. Retail arrival is the distribution phase — the moment when early holders have a large pool of new buyers to sell into.
4. Pi Cycle Top Indicator
The Pi Cycle Top uses two moving averages of Bitcoin’s price — the 111-day MA and the 350-day MA multiplied by 2. Historically, when the 111-day MA crosses above the 350×2 MA, it has signalled within days of the cycle top.
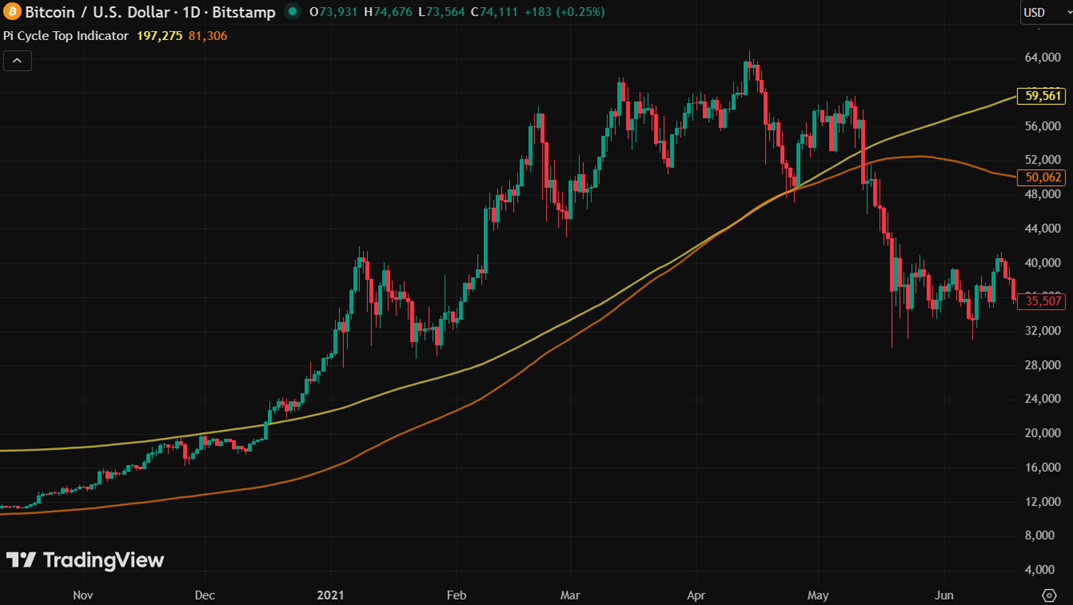
Limitation: this indicator has only been tested on three cycle tops. With a sample size of three, it is evidence, not certainty. It also provides no signal at all outside the specific crossover moment.
5. Altcoin Behaviour — The Late-Cycle Speculative Signal
A characteristic of every cycle top has been the final altcoin frenzy — a period where highly speculative assets (meme coins, newly launched tokens with no revenue) generate the largest percentage gains, often 5–20x in weeks. This is the moment of maximum speculative excess.
When the assets generating the most attention and the largest returns are the most fundamentally worthless, the cycle is almost certainly in its final phase. Capital has rotated so far down the risk spectrum that there is nowhere left to go.
Bottom Signals — What to Watch Near Cycle Lows
1. MVRV Z-Score in the Green Zone
The same indicator that signals tops also signals bottoms. When MVRV Z-Score falls into the green zone (historically below 0–1), the market is trading below the aggregate cost basis of all holders. Every major Bitcoin cycle bottom has occurred in or near this zone.
| Cycle Bottom | Approximate MVRV Z-Score at Low | BTC Price at Low |
|---|---|---|
| January 2015 | ~0.1 | ~$150 |
| December 2018 | ~0.3 | ~$3,200 |
| November 2022 | ~0.5 | ~$15,500 |
The rising cycle bottom in absolute terms ($150 → $3,200 → $15,500) reflects the growing base of long-term holders who provide a structural price floor that rises with each cycle.
2. Realised Price — Are We Below Cost Basis?
Realised price is the average cost basis of all Bitcoin in existence — the price at which, on average, every coin last moved. When spot price falls below realised price, the average holder is underwater.
This condition — spot below realised price — has historically been a reliable indicator that the market is near or at a cycle bottom. It represents maximum pain for holders, maximum pessimism in the market, and the point at which weak hands have largely finished selling.
Practical use: when BTC is trading below its realised price, the risk/reward of accumulation is historically favourable. This is not a bottom call — price can stay below realised price for months — but it shifts probabilities significantly.
3. Puell Multiple — Miner Revenue as a Bottom Indicator
The Puell Multiple measures the daily revenue of Bitcoin miners relative to its 365-day moving average. During bear markets, Bitcoin price falls while mining difficulty adjusts slowly, compressing miner margins. When the Puell Multiple falls below 0.5, miners are earning significantly below their historical average — a condition that has coincided with cycle bottoms in every previous cycle.
The logic is straightforward: when miners are under extreme financial stress, the weakest operators shut down and sell their holdings, creating forced selling pressure. Once this forced selling is exhausted, the supply overhang clears.
4. Sentiment Extremes — The Fear and Greed Index
The Crypto Fear and Greed Index aggregates multiple sentiment inputs (price momentum, social media volume, Google Trends, volatility, market dominance) into a single 0–100 score. Readings below 10 — extreme fear — have historically occurred near cycle bottoms.
Important caveat: sentiment can remain at extreme fear for extended periods during prolonged bear markets. A reading of 8 does not mean the bottom is today. It means conditions are consistent with prior bottoms — which is meaningful context, not a timing signal.
5. On-Chain Accumulation — Long-Term Holders Buying
One of the cleanest bottom signals in on-chain data is the behaviour of long-term holders (addresses that have not moved Bitcoin in more than 155 days). Near cycle bottoms, long-term holder supply typically reaches its highest level of the cycle — experienced participants are accumulating while short-term holders and retail participants are selling.
Glassnode’s Long-Term Holder Net Position Change metric makes this visible. When it turns consistently positive during a bear market, it signals that smart money accumulation is underway — not that the bottom is in, but that the market is transitioning from distribution to accumulation.
Weekly Moving Averages — The Structural Price Framework
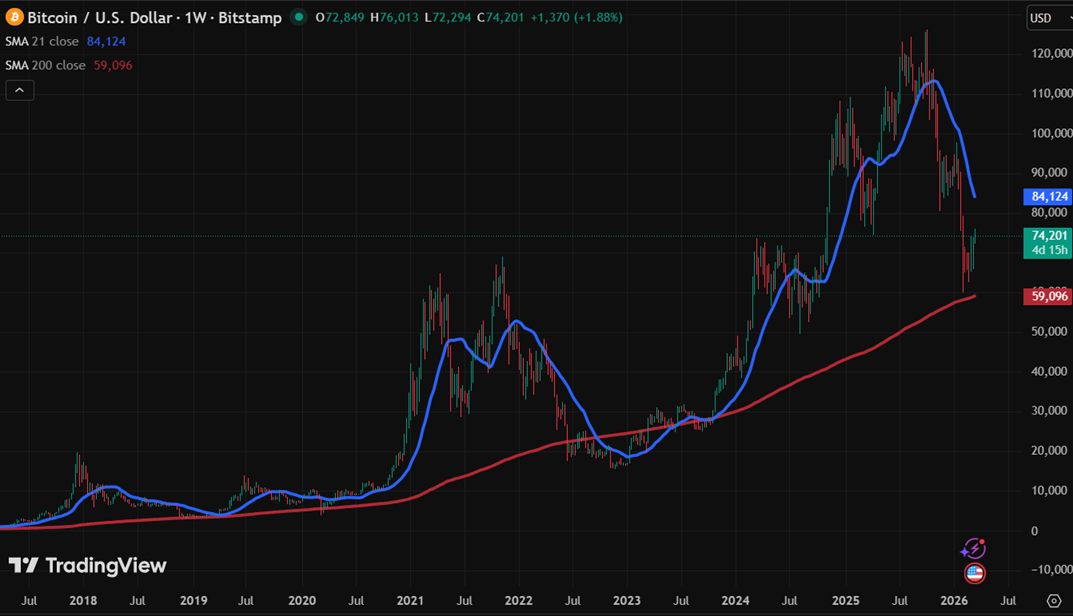
On-chain indicators measure what holders are doing. Weekly moving averages measure what price is doing relative to its own long-term history. The two most battle-tested MAs for Bitcoin cycle analysis are the 200-week and 21-week moving averages — one for bottoms, one for trend.
200-Week MA — The Cycle Bottom Floor
Bitcoin has never closed a weekly candle below the 200-week MA in any bear market across its entire history. In 2015, 2018–19 and 2022, price touched or briefly pierced the 200W MA intraweek before recovering. Each instance was within weeks of the cycle bottom.
The 200W MA functions as a structural value anchor — the level at which long-term institutional buyers have historically stepped in. It rises with each cycle as Bitcoin’s adoption baseline grows, providing an ever-higher floor.
Practical use: when price is trading at or near the 200W MA during a bear market, the historical risk/reward of accumulation is as favourable as it gets. This is not a guarantee — it is the single most powerful bottom-proximity indicator available on price alone.
21-Week MA — The Bull Market Trend Filter
The 21-week MA acts as dynamic support in a bull market. During every sustained uptrend, Bitcoin has consistently bounced from the 21W MA on weekly closes, with short-term pierces followed by recovery.
The top-warning signal: when Bitcoin closes a weekly candle below the 21W MA after an extended bull run, it signals that the trend is breaking down. In May 2021, the first weekly close below the 21W MA coincided almost exactly with the local cycle top at $64,000.
| Signal | Indicator | What It Indicates |
|---|---|---|
| Bottom proximity | Price at or near 200W MA | Historically extreme value — highest-conviction accumulation zone |
| Bull trend intact | Price holding above 21W MA on weekly close | Trend continuation — reduce hedges, hold exposure |
| Top warning | Weekly close below 21W MA | Trend breakdown — begin systematic risk reduction |
| Top confirmation | Pi Cycle Top crossover (111d / 350d×2) | Historical precision exit signal — maximum urgency to reduce |
The 200W and 21W MAs are complementary: one defines the bottom range, the other defines trend health throughout the cycle. Together they provide a structural price framework that requires no on-chain data and works directly on the weekly BTC chart.
Where to find them: any TradingView chart on weekly timeframe — add MA with length 200 and MA with length 21.
Combining the Signals — A Weight-of-Evidence Approach
No single indicator is sufficient. The framework works by counting how many signals are aligned simultaneously.
| Signal | Top Warning | Bottom Signal |
|---|---|---|
| MVRV Z-Score | Above 6 (red zone) | Below 1 (green zone) |
| Spot vs Realised Price | Far above realised price | Below realised price |
| Puell Multiple | Above 4 (miner overearning) | Below 0.5 (miner stress) |
| Funding Rates | Persistently above 0.05%/8h | Persistently negative |
| Retail Sentiment | Mainstream euphoria | Mainstream disinterest / contempt |
| Altcoin behaviour | Meme/junk coins leading | Only BTC and ETH with volume |
| Long-Term Holder flow | LTH distributing | LTH accumulating |
| 21-Week MA | Weekly close below 21W MA | Price reclaims 21W MA after bear |
| 200-Week MA | Far above 200W MA (parabolic) | Price at or touching 200W MA |
When four or more signals are aligned in the same direction, the weight of evidence is meaningful. When all seven are aligned, conditions are as extreme as they get — and historically, those have been the moments with the best risk/reward for the opposite trade.
The Practical Takeaway — What to Actually Do
Near a top: the objective is not to sell everything at the peak. It is to systematically reduce risk as signals accumulate. Start reducing altcoin exposure when three or more top signals are present. Move a portion to stablecoins. Set tighter stops on remaining positions. Accept that you may leave some upside on the table in exchange for protecting most of the gains.
Near a bottom: the objective is not to buy the exact low. It is to accumulate in stages as conditions become more favourable. Start initial positions when MVRV enters the green zone. Add as long-term holder accumulation confirms. Accept that you will buy before the bottom and that prices may fall further — size positions accordingly.
The one rule: never use maximum leverage at the extremes. The cost of being wrong at a top (leveraged long) or at a bottom (leveraged short) is catastrophic and permanent. These frameworks are for directional conviction, not for amplifying it.
Key Takeaways
- No indicator reliably calls exact tops or bottoms — the goal is a weight-of-evidence framework that shifts probabilities
- MVRV Z-Score is the single most historically reliable on-chain cycle indicator for both tops and bottoms
- Top signals cluster around on-chain overvaluation, extreme leverage, retail euphoria and late-cycle speculative excess
- Bottom signals cluster around on-chain undervaluation, miner stress, sentiment extremes and long-term holder accumulation
- The 200-week MA has never been broken on a weekly close — it is the most reliable bottom-proximity signal available on price alone
- The 21-week MA is the bull market trend filter — a weekly close below it is the first structural warning that a top may be forming
- When four or more signals align simultaneously, the weight of evidence is historically meaningful — act on it by adjusting position sizing, not by making all-or-nothing calls