
Introduction
Every transaction on a public blockchain is permanently recorded and publicly visible. This creates a data set that has no equivalent in traditional markets — the complete transaction history of every asset, including when it was bought, at what price, and when it moved.
On-chain indicators use this data to construct metrics that reveal the aggregate behaviour of market participants: are holders sitting on large unrealised gains or losses? Are miners under financial stress? Is the market overvalued or undervalued relative to its own history? These are questions that on-chain data answers with a precision that sentiment surveys and price charts alone cannot match.
This article covers four of the most established on-chain cycle indicators — MVRV, SOPR, the Puell Multiple and NVT — what each one measures, how to read it, and where it fits in a broader analytical framework.
The Foundation — Realised Cap and Cost Basis
Before covering the individual indicators, it helps to understand the concept that underpins most of them: realised cap and cost basis.
Traditional market cap = current price × total supply. This treats a Bitcoin last moved in 2010 at $0.10 as if it is worth today’s price — which is misleading for analytical purposes.
Realised cap recalculates market cap by valuing each Bitcoin at the price it last moved on-chain. A coin that last transacted at $30,000 contributes $30,000 to the realised cap, not today’s price. The result is a measure of the aggregate cost basis of all Bitcoin in existence — what the market collectively paid for its holdings.
This concept is the building block of MVRV, and understanding it makes the other indicators much clearer.
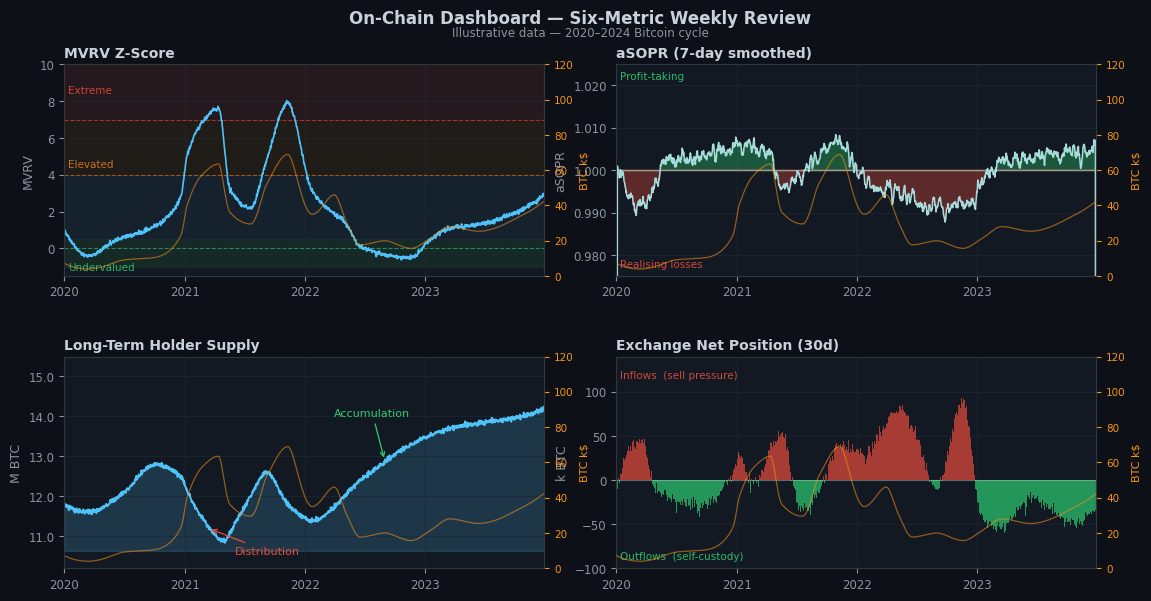
MVRV — Market Value to Realised Value
What it measures: the ratio of Bitcoin’s market cap to its realised cap. In plain terms: how much profit (or loss) is the market sitting on, in aggregate, relative to what it paid?
Formula: MVRV = Market Cap / Realised Cap
An MVRV above 1.0 means the average holder is in profit. An MVRV below 1.0 means the average holder is underwater. The Z-Score variant normalises this ratio against its historical standard deviation, making comparisons across time more meaningful.
| MVRV Z-Score Range | Market Condition | Historical Signal |
|---|---|---|
| Above 7 | Extreme overvaluation | Every major cycle top has occurred in this zone |
| 3–7 | Bull market, elevated | Continued upside possible but risk increasing |
| 1–3 | Fair value range | Neither extreme — monitor direction |
| 0–1 | Approaching undervaluation | Historically favourable accumulation zone |
| Below 0 | Extreme undervaluation | Every major cycle bottom has occurred here or just above |
How to use MVRV in practice
MVRV is most useful as a risk management tool rather than a timing tool. When Z-Score is above 6, the rational response is to reduce leverage and take partial profits — not because a top is imminent, but because the risk/reward of holding maximum risk at maximum overvaluation is unfavourable. When Z-Score is below 1, the rational response is to accumulate in stages, accepting that the bottom may not be in but that expected value over a 12–24 month horizon is historically strong.
What MVRV does not tell you: it does not tell you when the top or bottom will occur. An MVRV Z-Score of 8 can persist for weeks or months before reverting. Use it to adjust position sizing, not to make binary buy/sell decisions.
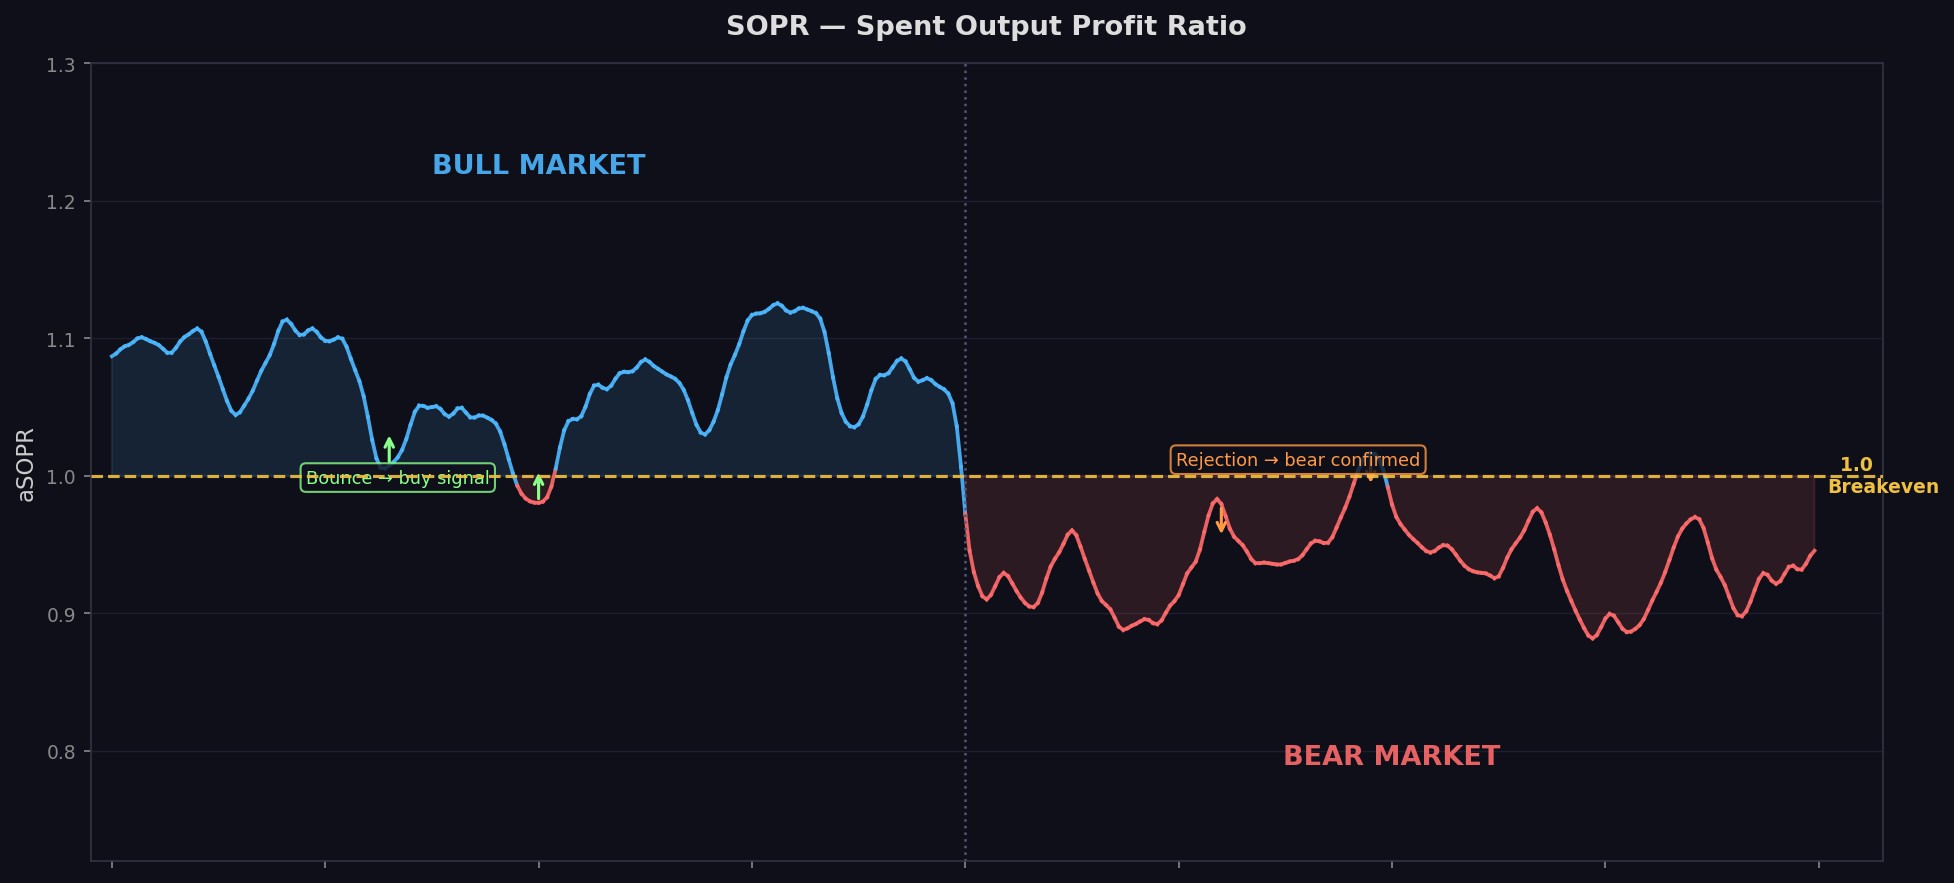
SOPR — Spent Output Profit Ratio
What it measures: the aggregate profit or loss realised by all Bitcoin that moved on-chain on a given day. SOPR = the price at which coins were sold divided by the price at which they were acquired.
A SOPR above 1.0 means that coins moving on-chain today were sold at a profit. A SOPR below 1.0 means they were sold at a loss.
Reading SOPR in bull and bear markets
SOPR’s most powerful signals come from its behaviour around the 1.0 level — the breakeven point.
In a bull market: when SOPR dips toward 1.0 and then bounces, it signals that holders are unwilling to sell at breakeven — they expect higher prices and hold through dips. This ”SOPR reset” is a buy signal in an established uptrend. Each successful bounce from 1.0 confirms the bull market is intact.
In a bear market: when SOPR rises toward 1.0 and then rejects, it signals that holders who have been underwater are selling as soon as they break even — relief selling. Each failed attempt to hold above 1.0 confirms the bear market is intact.
The transition signal: a sustained break above 1.0 after an extended period below — combined with SOPR holding above 1.0 on retests — is one of the strongest signals that a bear market has ended and a new accumulation phase has begun.
Adjusted SOPR (aSOPR)
The standard SOPR includes short-term movements that add noise — coins moved within hours of acquisition. Adjusted SOPR (aSOPR) filters out coins held for less than one hour, producing a cleaner signal that better reflects deliberate profit-taking or loss-realisation decisions.
For cycle analysis, aSOPR is generally preferred.
Puell Multiple — Miner Revenue as a Market Signal
What it measures: the ratio of daily Bitcoin miner revenue (in USD) to the 365-day moving average of daily miner revenue.
Formula: Puell Multiple = Daily miner revenue / 365-day MA of daily miner revenue
Miners are forced sellers — they must sell a portion of their Bitcoin to cover electricity, hardware and operational costs. Their behaviour creates a predictable pattern across cycles.
Why miner behaviour matters
When Bitcoin price is high, miner revenue is high relative to costs — the Puell Multiple rises above 1.0. Miners are profitable, and some sell more than they need to cover costs, locking in gains. This selling pressure is a headwind for price at cycle tops.
When Bitcoin price is low, miner revenue falls below break-even for many operations — the Puell Multiple falls well below 1.0. Inefficient miners shut down. The most distressed operators are forced to sell their holdings, adding selling pressure at exactly the worst time. Once this forced selling exhausts itself, the supply overhang clears — one of the conditions for a market bottom.
| Puell Multiple Range | Miner Condition | Historical Signal |
|---|---|---|
| Above 4 | Miners significantly overearning | Historically near cycle tops — miner distribution phase |
| 1–4 | Normal operating range | No strong directional signal |
| 0.5–1 | Margins compressed | Caution — potential continued weakness |
| Below 0.5 | Widespread miner stress | Historically near cycle bottoms — forced selling being exhausted |
The halving effect on Puell Multiple
Bitcoin halvings directly halve miner revenue overnight, causing an immediate spike downward in the Puell Multiple. This creates temporary distortion — the post-halving Puell Multiple is artificially depressed until the 365-day MA adjusts. Be aware of this when reading the metric in the 3–6 months following a halving event.
NVT — Network Value to Transactions
What it measures: the ratio of Bitcoin’s market cap (network value) to the daily value of transactions settled on the network. It is the crypto equivalent of a price-to-earnings ratio — how much is the market paying for each unit of economic activity on the network?
Formula: NVT = Market Cap / Daily Transaction Volume (USD)
A high NVT means the market is paying a high premium relative to actual network usage. A low NVT means the network is undervalued relative to its transaction activity.
NVT Signal (NVT-S)
The raw NVT ratio is noisy because daily transaction volume fluctuates significantly. The NVT Signal smooths the transaction volume with a 90-day moving average, producing a more stable and actionable version of the metric.
| NVT Signal Reading | Interpretation |
|---|---|
| Above 150 | Network significantly overvalued relative to usage — historically near tops |
| 45–150 | Normal range — monitor trend direction |
| Below 45 | Network undervalued relative to usage — historically near bottoms |
Limitations of NVT
NVT has become less reliable as a standalone indicator since the growth of Layer 2 networks. A significant portion of Bitcoin and Ethereum economic activity now occurs off the main chain — on Lightning Network, Arbitrum, Optimism and other scaling solutions — and is not captured in on-chain transaction volume. This structurally suppresses transaction volume relative to prior cycles, making NVT appear elevated even in neutral conditions.
Use NVT as a supporting indicator alongside MVRV and SOPR rather than as a primary signal.
Using the Four Indicators Together
Each indicator provides a different perspective on the same underlying question: where are we in the market cycle?
| Indicator | What It Captures | Best Used For |
|---|---|---|
| MVRV Z-Score | Aggregate unrealised profit/loss of all holders | Identifying macro over/undervaluation — risk management at extremes |
| aSOPR | Daily realised profit/loss — holder behaviour in real time | Confirming bull/bear regime and identifying trend continuations |
| Puell Multiple | Miner revenue stress or excess | Identifying miner-driven selling pressure and exhaustion near bottoms |
| NVT Signal | Valuation relative to network usage | Supporting indicator for over/undervaluation — cross-check for MVRV |
A practical approach: check MVRV monthly to understand the macro position. Monitor aSOPR weekly to track whether bull or bear dynamics are dominant. Check the Puell Multiple after significant price drops to assess whether miner stress is a factor. Use NVT as a sanity check on valuation when MVRV gives an ambiguous reading.
Where to Access These Indicators
All four indicators are available on multiple platforms, with varying levels of free access.
| Platform | Free Tier Coverage | Notes |
|---|---|---|
| Glassnode | MVRV, basic SOPR, Puell Multiple (with delay) | Most comprehensive on-chain data platform — paid tier removes delays and unlocks advanced metrics |
| Look Into Bitcoin | MVRV Z-Score, Pi Cycle, Puell Multiple (real-time) | Free, clean interface — best starting point for cycle indicators specifically |
| CryptoQuant | NVT, exchange flows, miner data | Strong on exchange and miner data; good complement to Glassnode |
| Bitcoin Magazine Pro | MVRV, SOPR, composite dashboards | Curated indicator dashboards — good for getting a quick multi-indicator overview |
Key Takeaways
- On-chain indicators give crypto analysts a data advantage that has no equivalent in traditional markets — the complete transaction history of every holder is publicly visible
- MVRV Z-Score is the most historically reliable cycle indicator — use it to manage risk at overvaluation extremes and identify accumulation opportunities at undervaluation extremes
- aSOPR reveals whether holders are in profit-taking or loss-realisation mode — its relationship with the 1.0 level confirms bull or bear market regimes
- The Puell Multiple captures miner stress cycles — below 0.5 has historically coincided with cycle bottoms as forced selling exhausts itself
- NVT is a useful supporting indicator but is structurally distorted by Layer 2 activity — weight it accordingly
- Use the four together as a weight-of-evidence system, not as individual buy or sell signals
Glassnode in Practice — A Weekly Review Routine →